Lean Six Sigma Greenbelt
Glossary
| Abbreviation | Term |
|---|---|
| LSS | Lean Six Sigma |
| VOC | Voice of Customer |
| PDCA | Plan->Do->Check->Act |
| DMAIC | Define->Measure->Analyze->Improve->Control |
| VOC | Voice of the Customer |
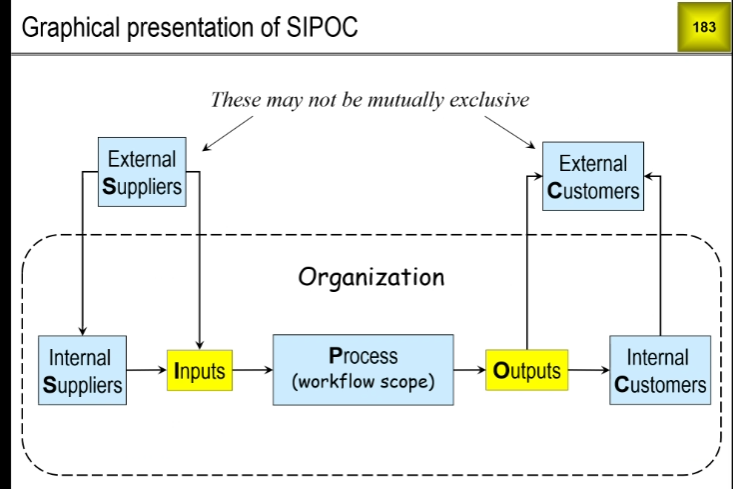
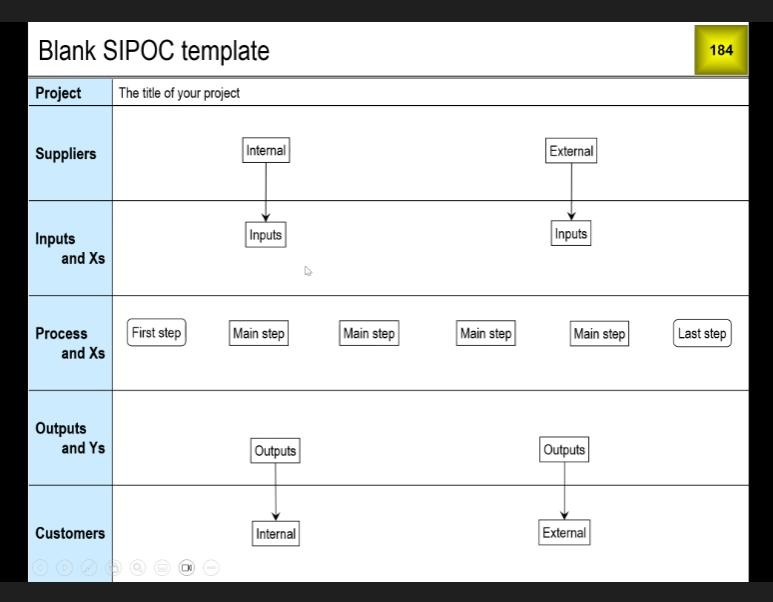
| SIPOC | Suppliers, Inputs, Process, Outputs, Customers |
Six Sigma Overview
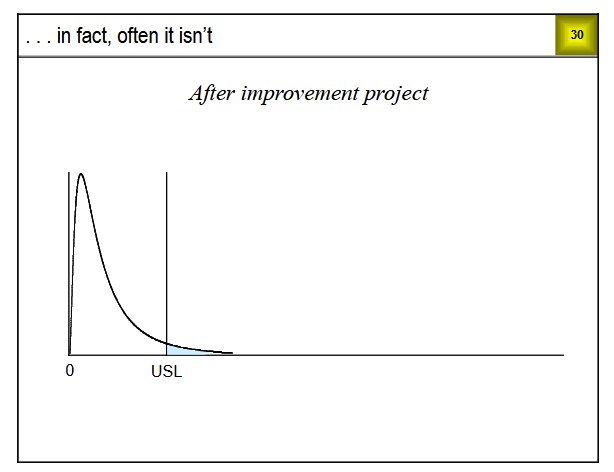
Process spread
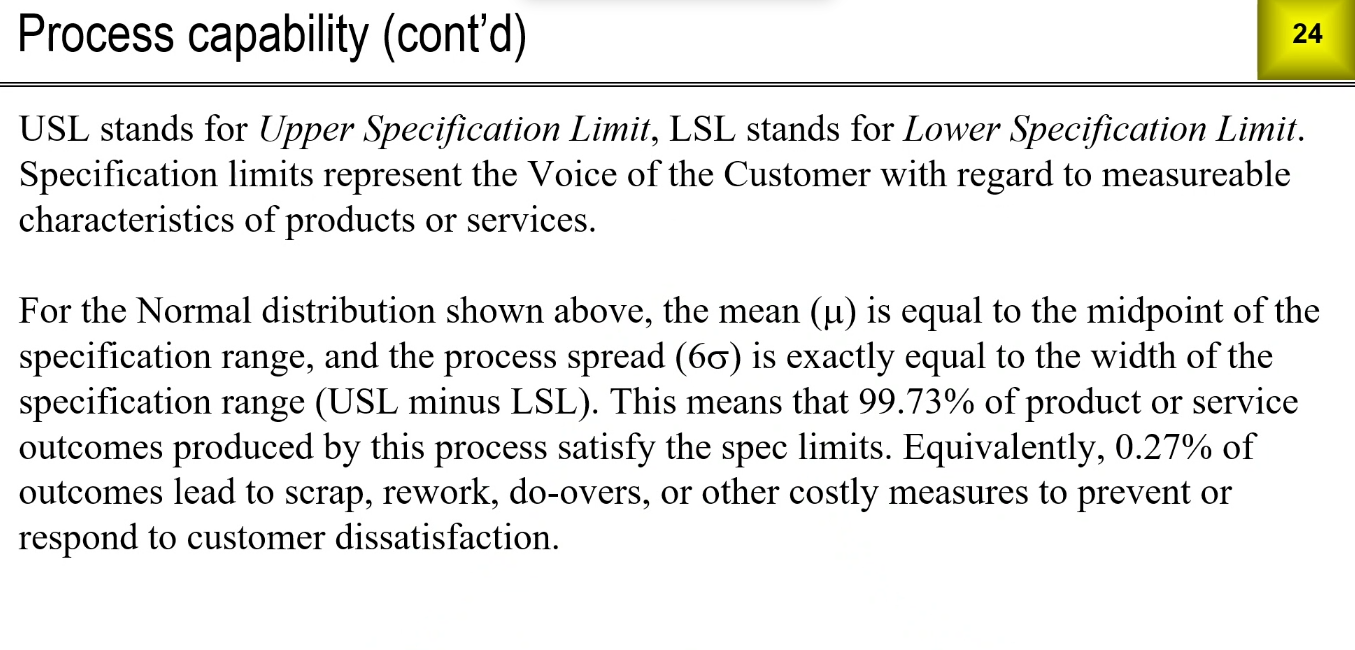
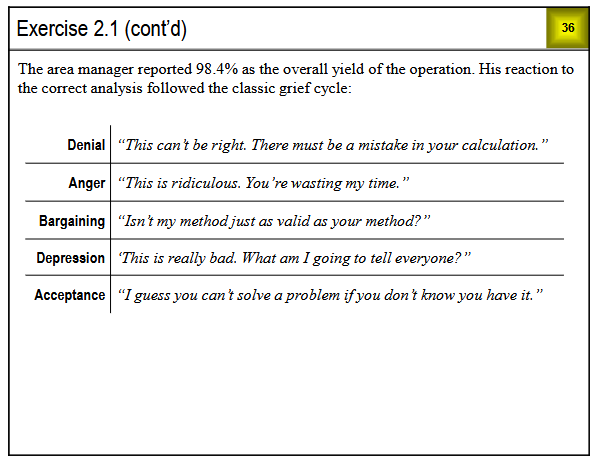
Pursuit of Perfect Quality
Pragmatic Business Initiative
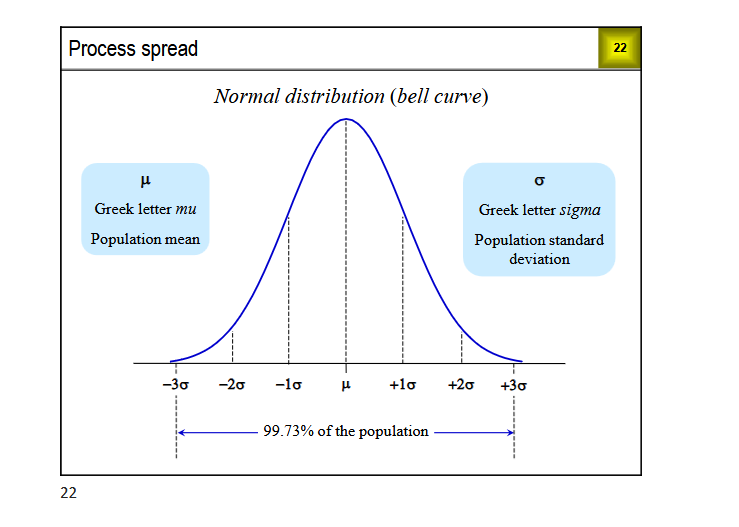
USL = stands for Upper Specification Limit
LSL = Lower Specification Limit
Six Sigma, you want to get your average to 3.4 defective parts per million
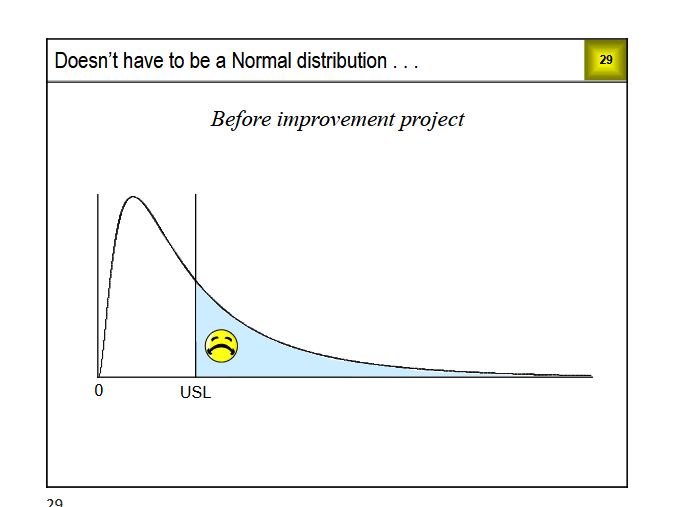
Distributions
We don't have to have a normal distribution
Why do we have to set the bar so high?
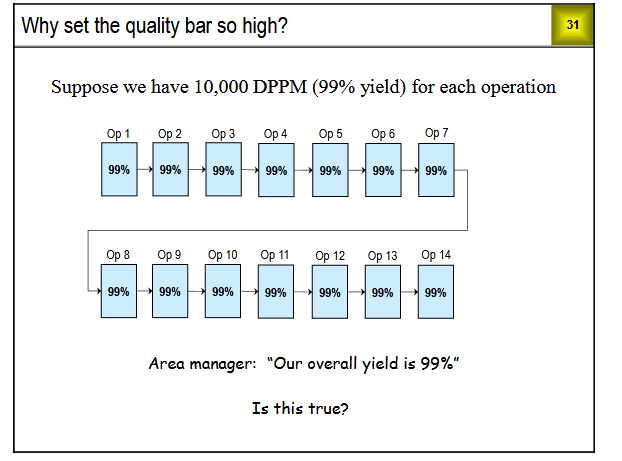
Say you have 14 operations with 99% yield for each operation...you end up with 86.9%
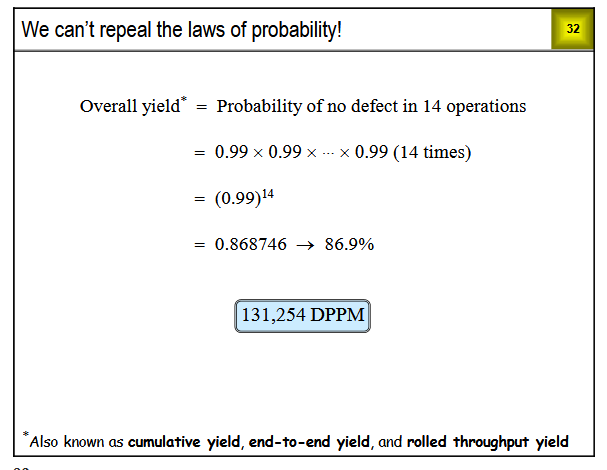
This is known as cumulative yield, end-to-end yield, and rolled throughput yield
56.4%
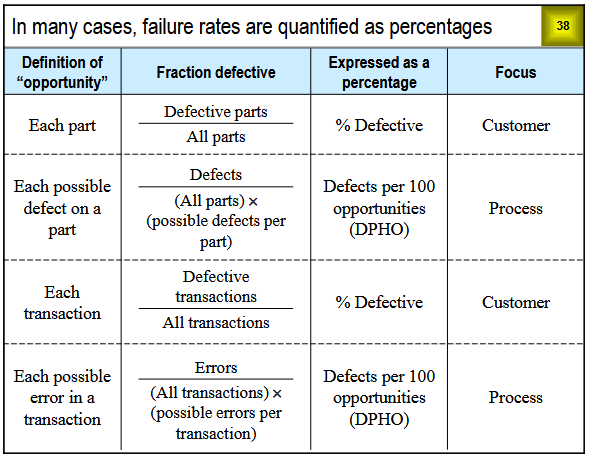
We can count defects instead of defective parts
Defects present opportunities
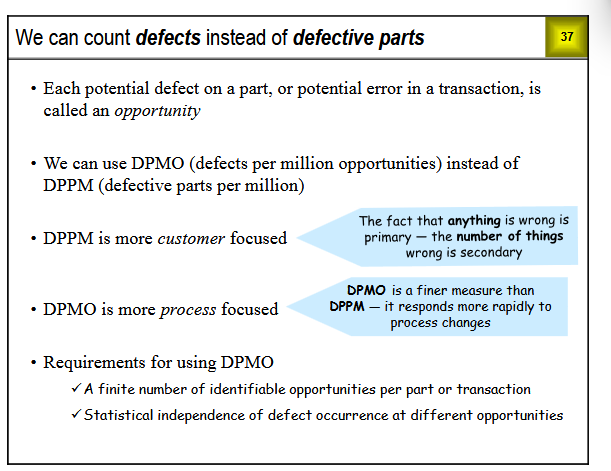
DPMO = Defects per million opporotunity
DPMO is more process focused
Example. 5 defects per part...reduced to 3 defects per part. Customer does not see a change, but you know you've made an appointment
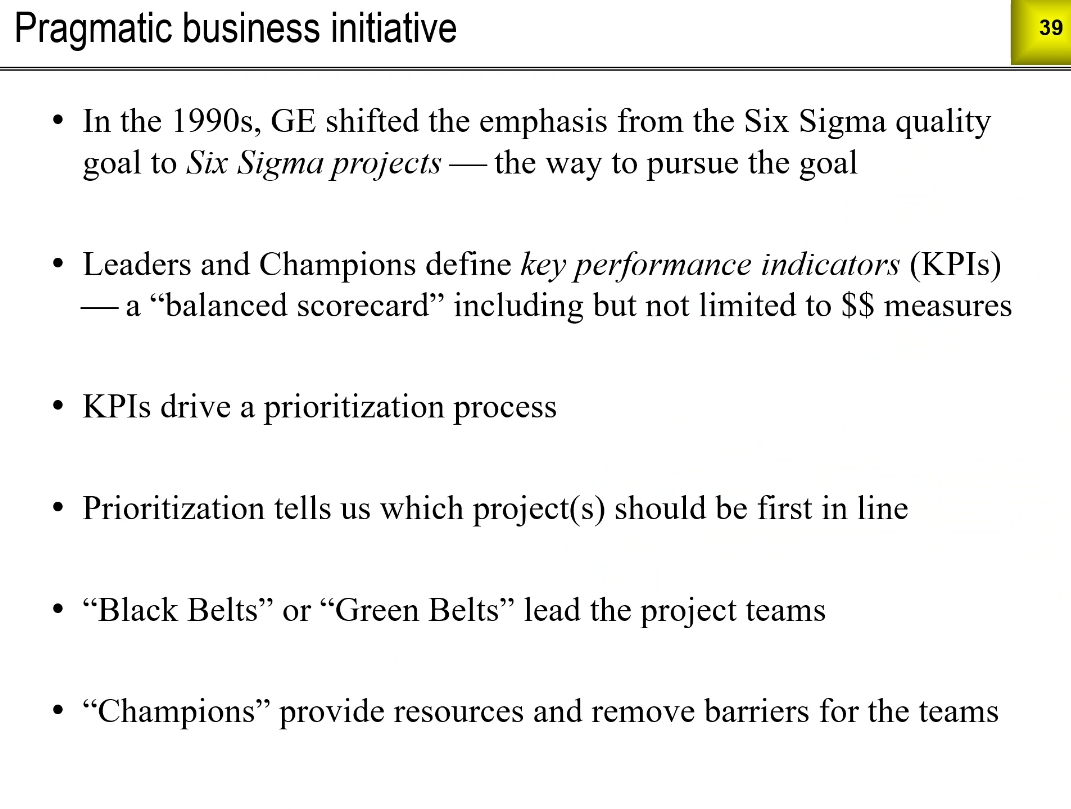
GE shifted to Six Sigma Projects in the 90's
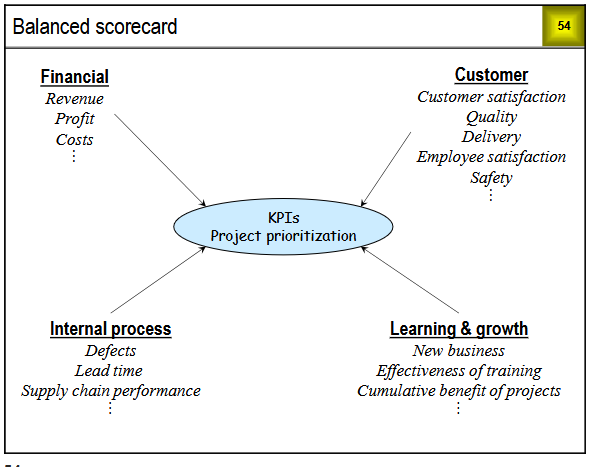
Leaders and Champions define KPI's
A "balanced scorecard" including but not limited to $measures
KPI's drive a prioritization process
Prioritization tells us which projects should be first in line
"Black or green belts" lead the teams
"Champions" provide resources
Champions:
- Management team members
- Identify and prioritize projects
- Assign project teams
- Provide teams with resources as needed
- Remove organizational barriers to project completion
- Provide project management support
- Community project results to the organization
Greenbelt vs Blackbelt
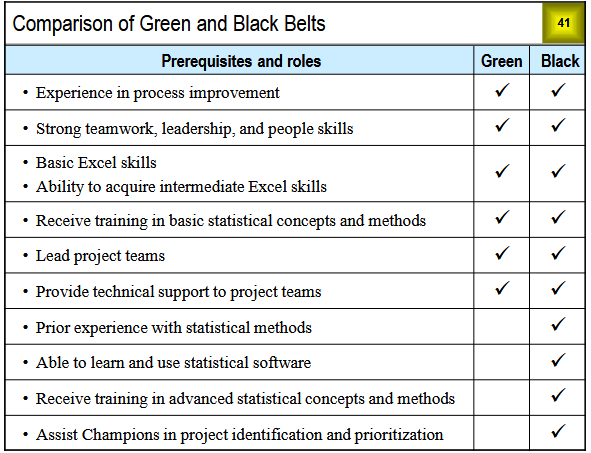
| Prerequisites & roles | Green | Black |
|---|---|---|
| Experience in process improvement | x | x |
| Strong teamwork, leadership, and people skills | x | x |
| Basic Excel skills | x | x |
| Receive training in basic statistical concepts and methods | x | x |
| Lead project teams | x | x |
| Provide technical support to project teams | x | x |
| Prior experience with statistical methods | x | |
| Able to learn and use statistical software | x | |
| Receive training in advanced statistical concepts and methods | x | |
| Assist Champions in project identification and prioritization | x |
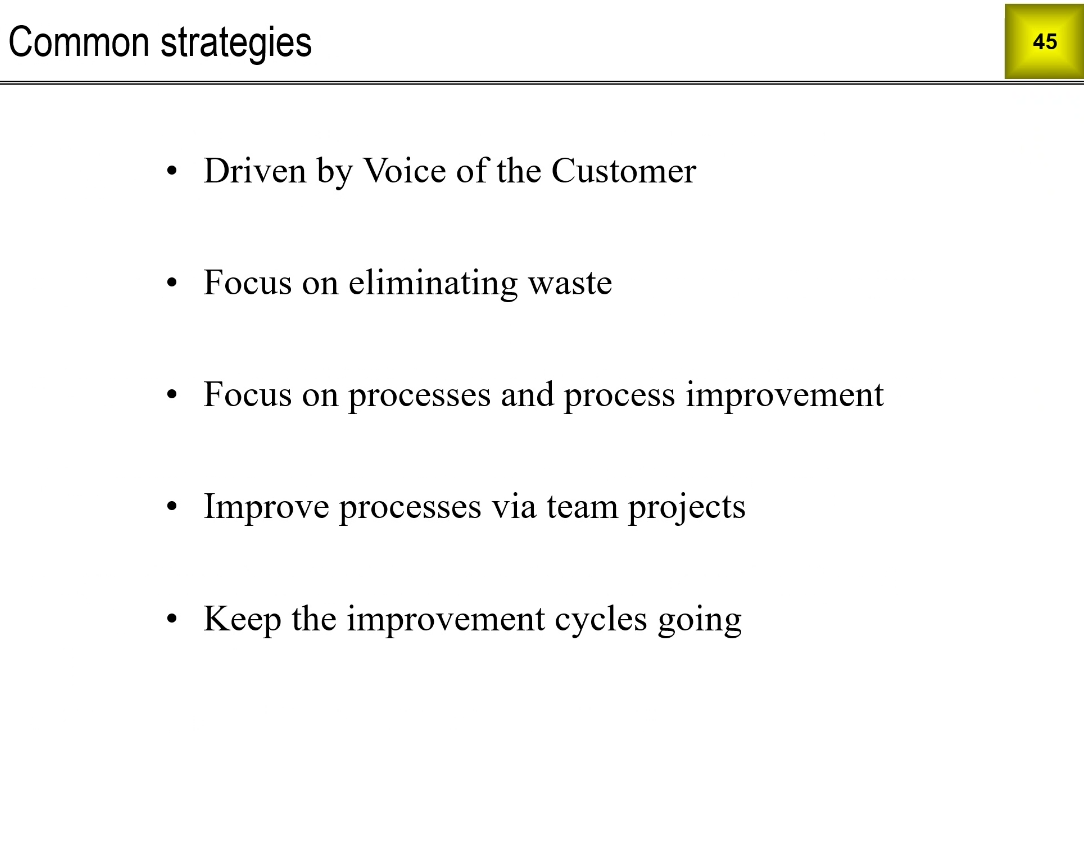
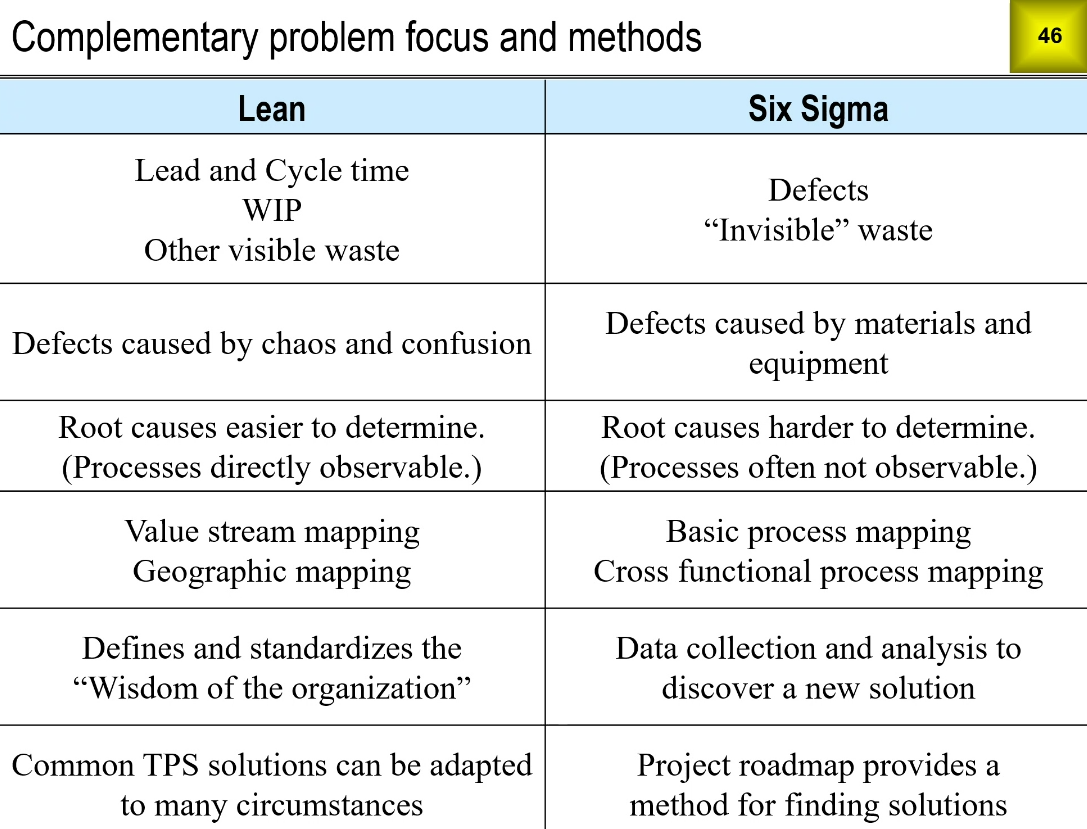
Lean is focused on time waste, Six Sigma is more focused on cost.
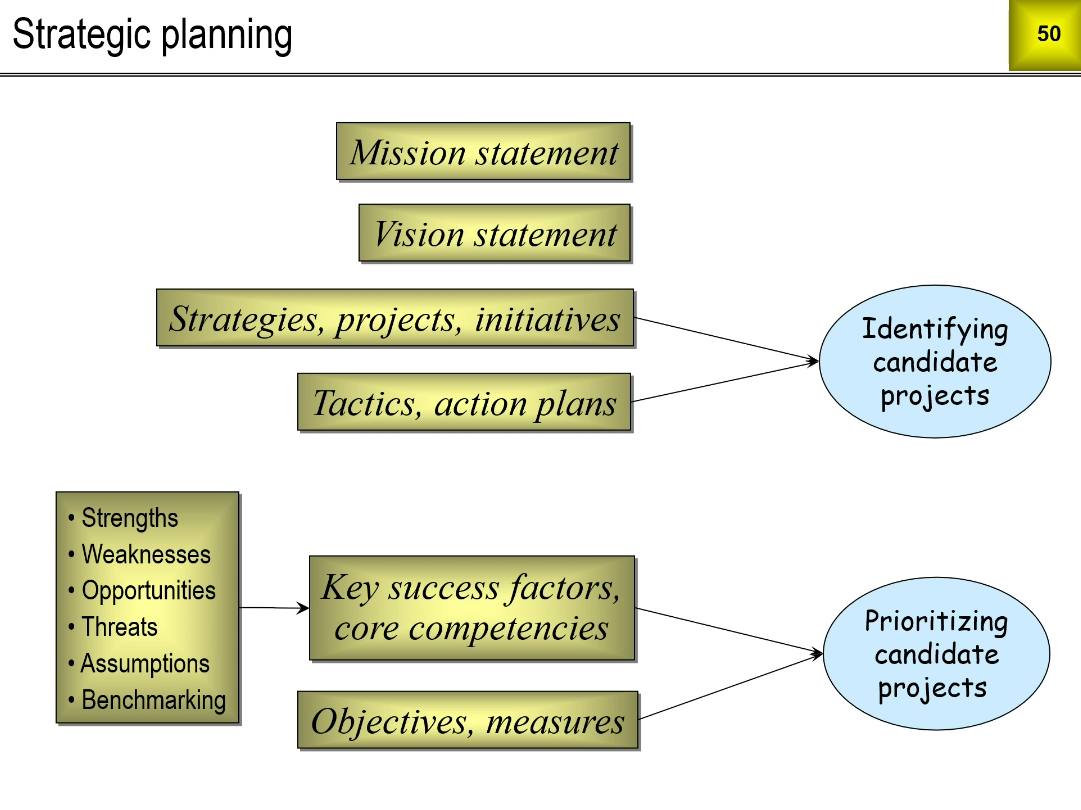
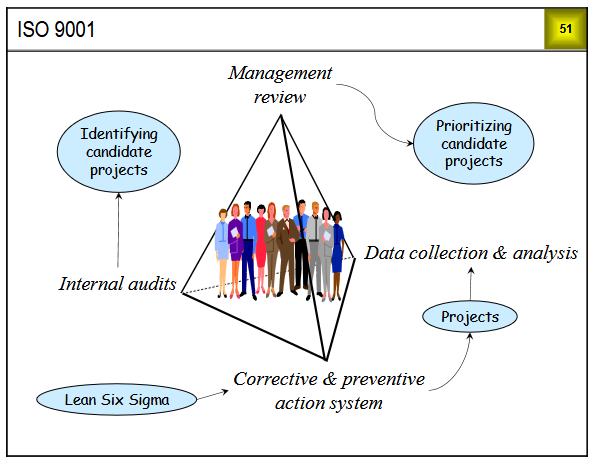
4 Relation of LSS to Other Initiatives
- Strategic Planning
- ISO 9001
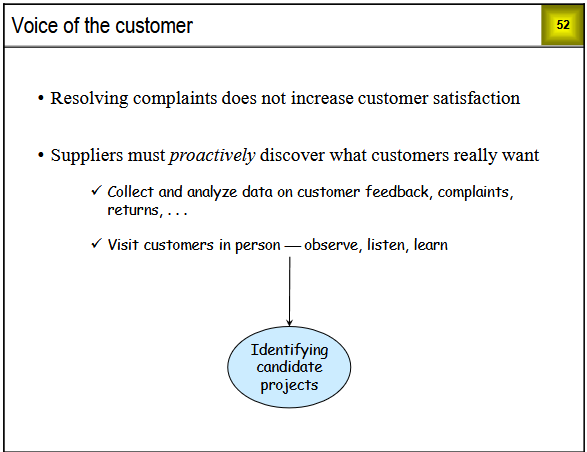
- Voice of the Customer
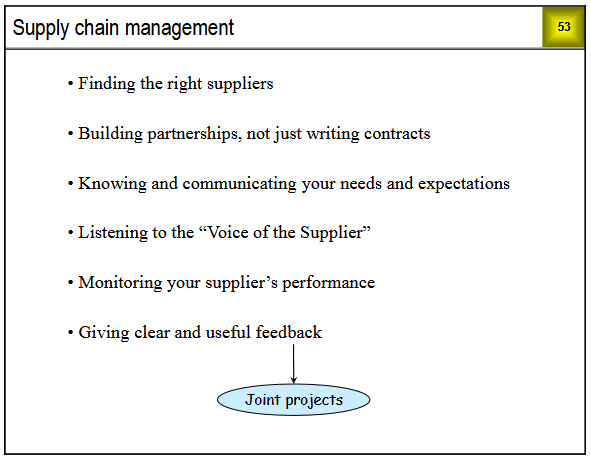
- Supply Chain Management
- Balanced Scorecard
What are the things we're tracking on a monthly basis?
Deploying LSS Projects
- Roles and Responsibilities
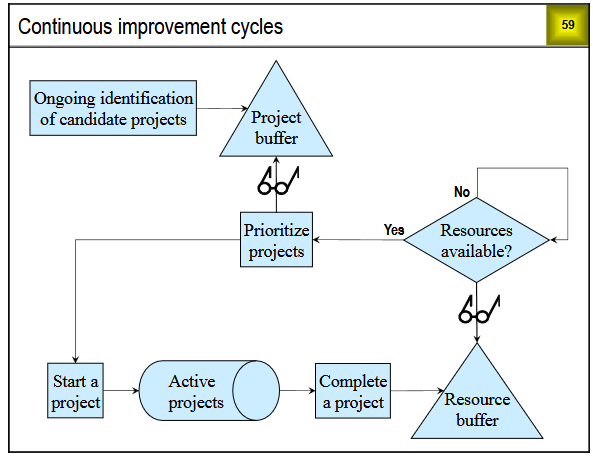
- Limiting Projects in Process
- The continuous improvement cycle
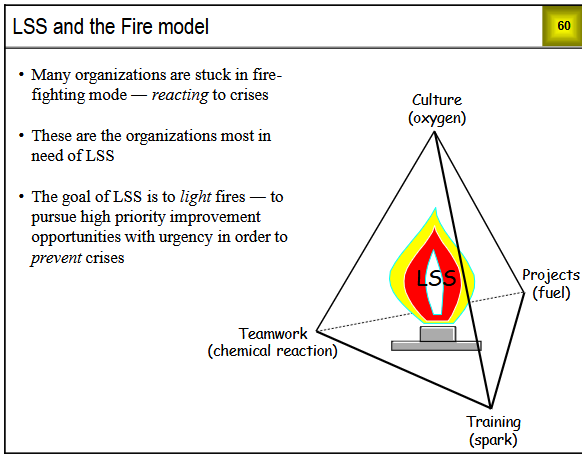
- LSS and the Fire Model
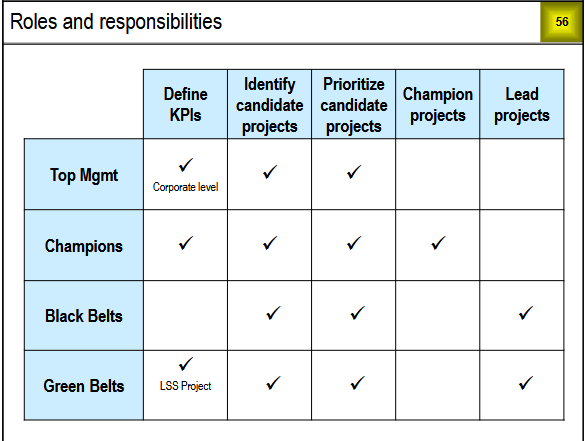
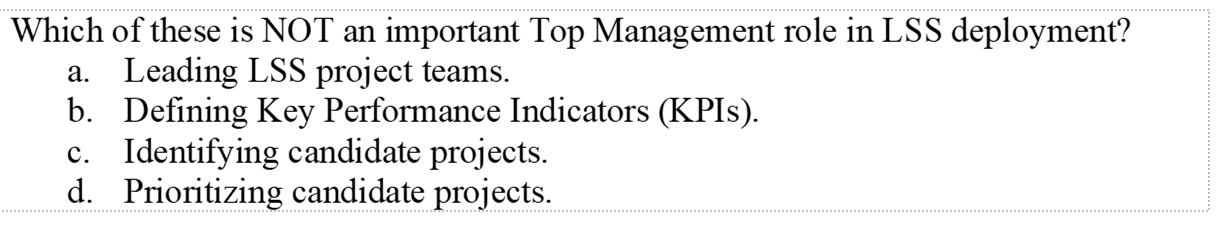
| Role | Define KPIs | Identify candidate projects | Prioritize candidate projects | Champion projects | Lead projects |
|---|---|---|---|---|---|
| Top Mgmt | ✓ (Corporate level) | ✓ | ✓ | ||
| Champions | ✓ | ✓ | ✓ | ✓ | |
| Black Belts | ✓ | ✓ | ✓ | ||
| Green Belts | ✓ (LSS Project) | ✓ | ✓ | ✓ |
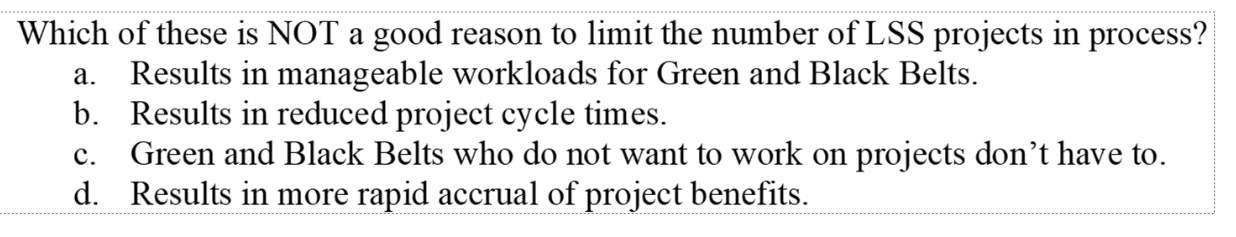
Too many projects in process is inefficient. Takes too long to get projects done, takes too long to accrue benefits
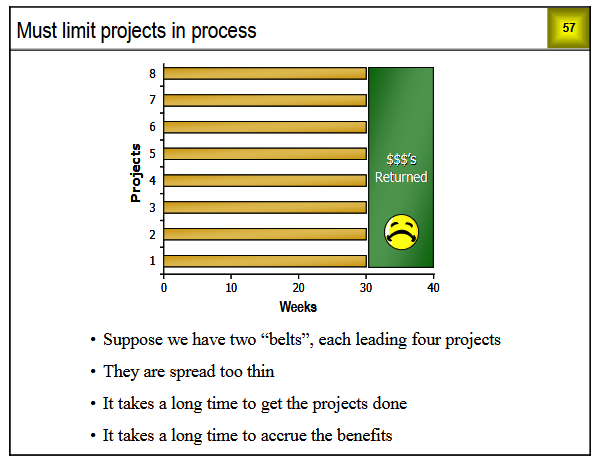
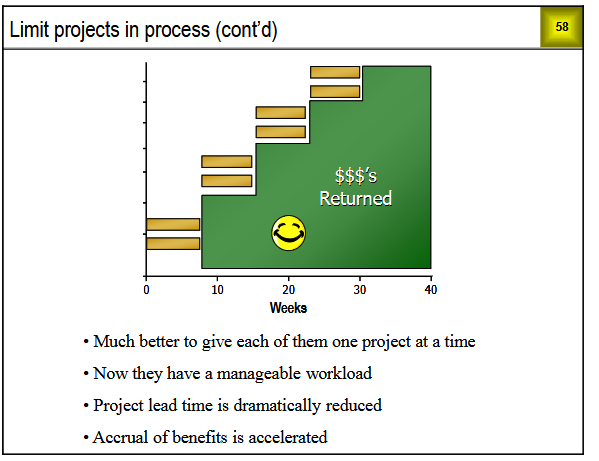
It's best to give each belt one project at a time because it gives people a manageable workload, reduces lead time, and accelerates accrual of benefits
Continuous Improvement Cycles
LSS and the Fire Model
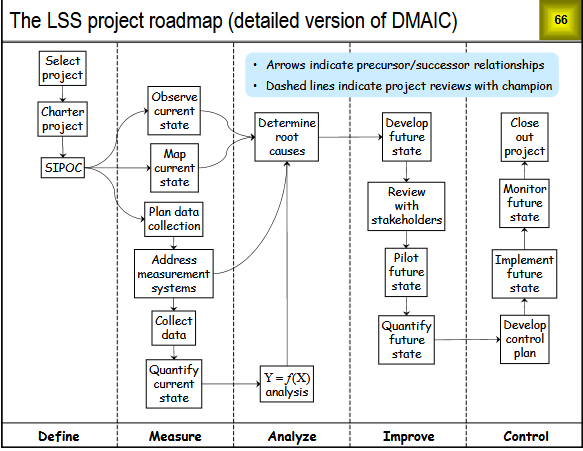
LSS Project Roadmap
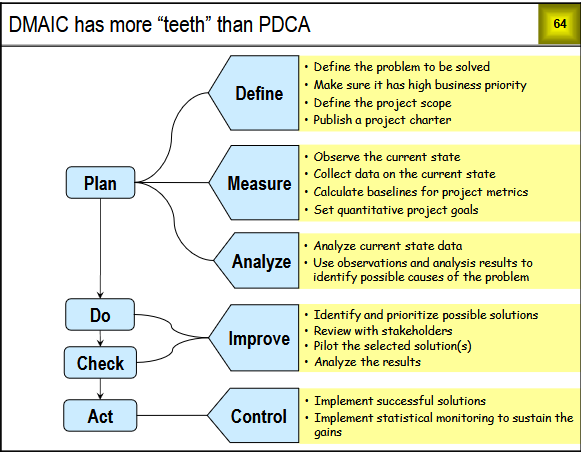
PDCA
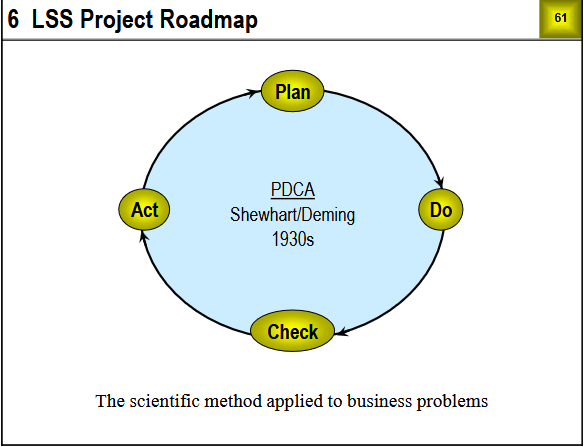
LSS follows a plan->do->check->act cycle
| Step | Definition |
|---|---|
| Plan | Define the problem to be solved, collect and analyize data on the current state, identified possible causes of the problem |
| Do | Identify possible solutions, select the most likely, pilot the solution |
| Check | Analyze the results to see if the problem is solved |
| Act | If the solution is successful, implement it. If the solution is not successful, repeat the cycle |
PDCA is the oldest improvement cycle for manufacturing, business, and service processes and has been around for more than 80 years.
DMAIC
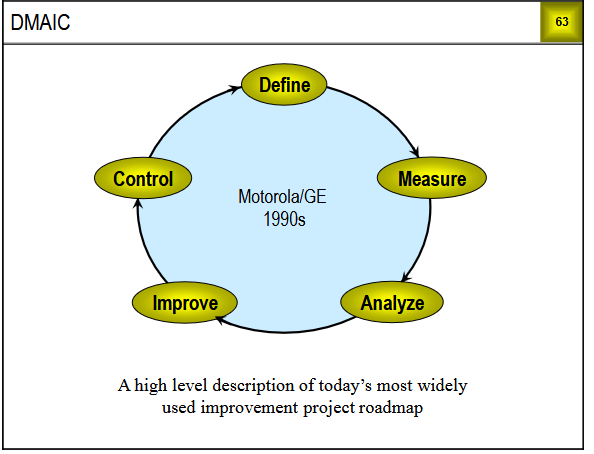
DMAIC has more "teeth" than PDCA
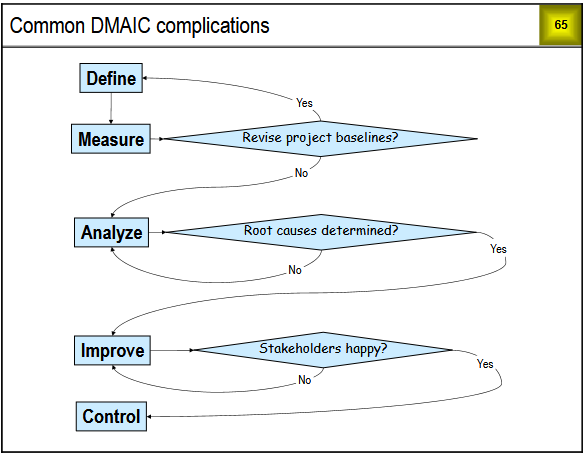
Common DMAIC Complications
The Lean Six Sigma Roadmap
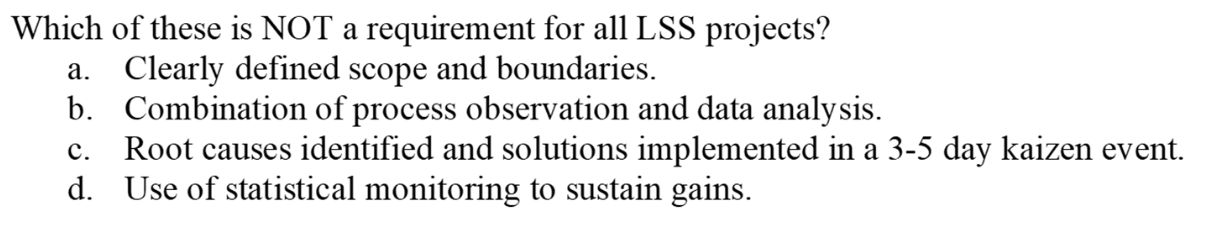
Strengths of LSS Projects
- Aligned with business priorities
- Clearly defined scope and boundaries
- Combination of process observation and data analysis
- Solve problems by understanding them
- Conclusions supported by statistical standards of evidence
- Improvements verified quantitatively
- Statistical monitoring used to sustain gains
Characteristics of LSS Projects
- We want to improve a process or product
- The current process or product falls measurably short of what is needed of desired
- the cause of the problem is not known, or there is a lack of consensus as to what it is
- Process observations and data collection/analysis are required
- Root cause analysis is required
- Lean solutions may not be applicable
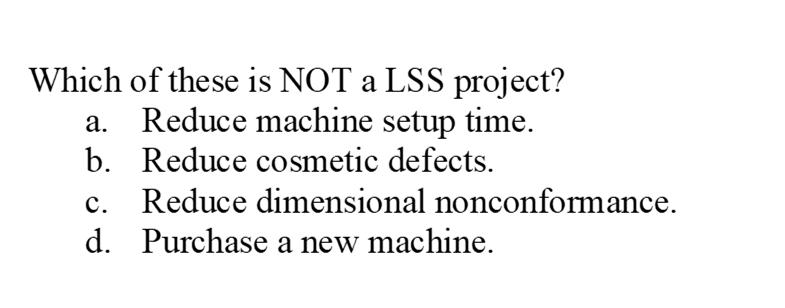
Examples of LSS Projects
| Project | Probability that LEAN solutions will apply |
|---|---|
| Reduce Injection Molding Defects | LOW |
| Reduce Injection Molding Setup Time | HIGH |
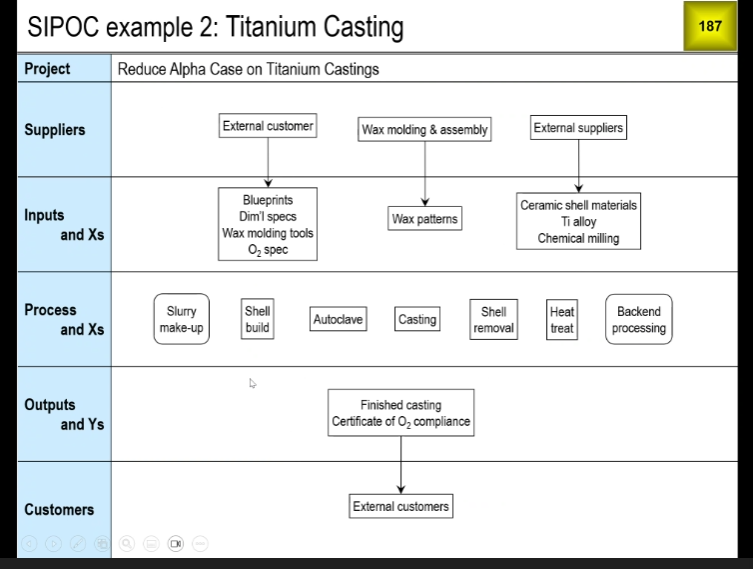
| Reduce Oxidation Layer on Ti Castings | LOW |
| Reduce Unplanned Downtime | MEDIUM |
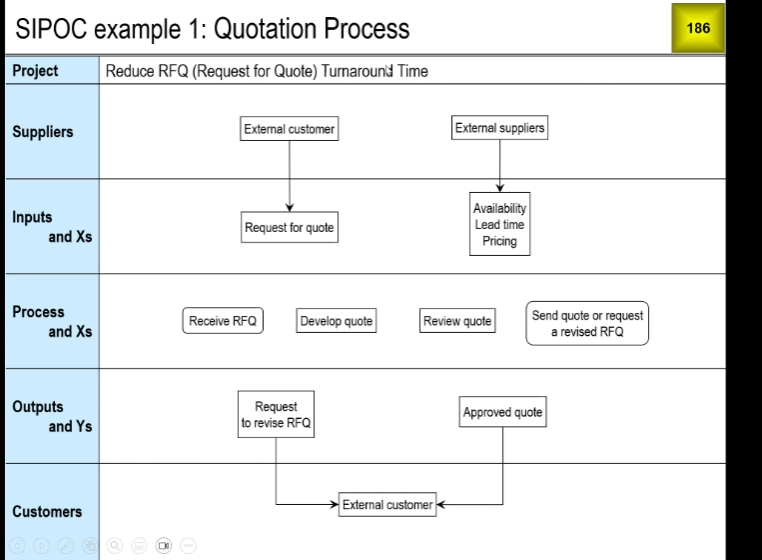
| Reduce Request for Quote turnaround time | HIGH |
| Reduce Repair Shop Turnaround Time | HIGH |
| Reduce the cost of belt grinding | LOW |
Other Types of Projects (NON LSS)
- We know what needs to be done, and we want to do it
- It may be simple, quick, and cheap
- It may be complex, time consuming, and or expensive
- All of the above involve implementing KNOWN solutions
- These projects could be action items resulting from a LSS project, but they are not themselves LSS projects
Examples of non-LSS projects
- Automate a task that is currently done manually
- Upgrade Software to the latest revision
- Revise outdated work instructions
- Install a new piece of equipment
- Obtain environmental permits
- Replace Outdated Computers
- Install a barcode system
- Build a plant in China
Exercise 6.1 Classify these Projects as LSS or Non-LSS
| Project | LSS | Other |
|---|---|---|
| Implement the New ERP system we have decided to use | x | |
| Reduce errors in processing purchase requisitions | x | |
| Reduce wave solder defects | x | |
| Open a new branch office in the next town | x | |
| Reduce billing lead time | x | |
| Install a web-based ordering system | x | |
| Reduce non-manufacturing time from order to sell | x | |
| Eliminate the cracking of molded housings | x | |
| Reduce installation and warranty costs | x | |
| Increase the percentage of quotes that produce a PO | x |
Identifying Candidate Projects
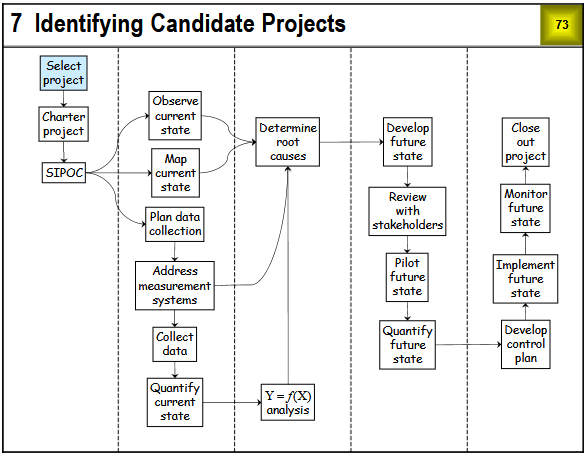
Where do Candidate Projects Come From?
- Benchmarking: if they can do it, why can't we?
- Vision of the future
- Demand expected to exceed current capacity
- Seems to require capital expenditure
- better to reduce defects and lead times
- Voice of the Customer (VOC)
- Quality
- Delivery
- Cost
- Service
- Cost of waste analysis
This class will focus on VOC and Cost of Waste Analysis
Capturing VOC Data
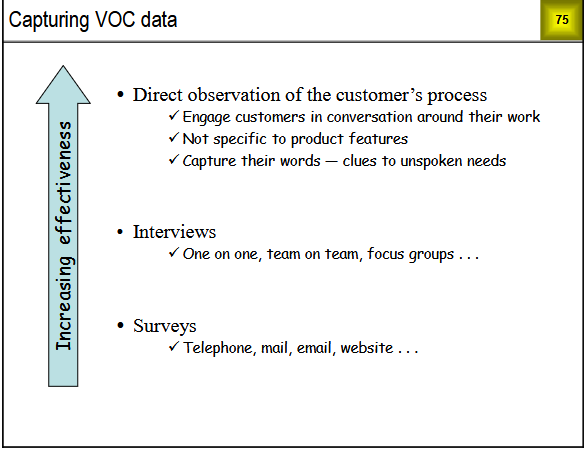
VOC Survey Method
Ask two questions for each customer requirement
- What is the importance of this requirement?
- What is your level of satisfaction with our performance relative to this requirement
- How important is it to you that we deliver or projects within one day of your requested delivery date
- What is your level of satisfaction with our delivery performance relative to your requested delivery date
Perceptual Map based on VOC data
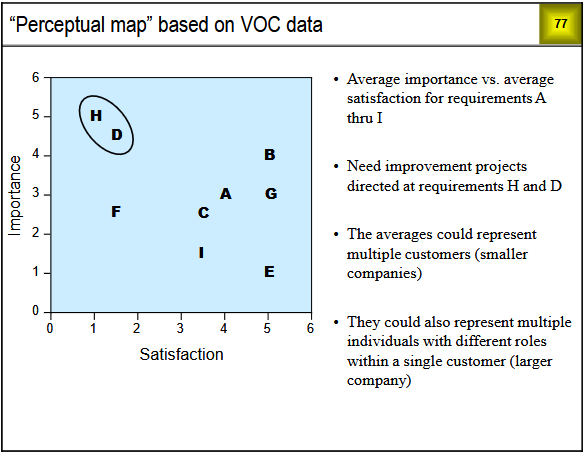
- What voice of customer information does your company receive, and how is it obtained
- Give examples of decisions, actions or improvement projects based on VOC information
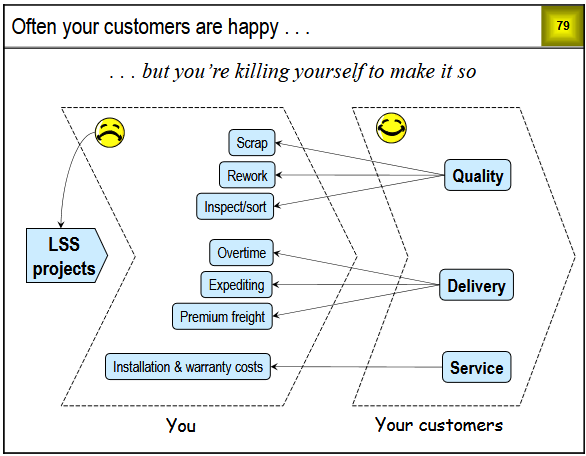
Often your customers are happy, but at a huge expense to your business. Voice of the customer doesn't always tell you something useful
Cost of Waste Analysis
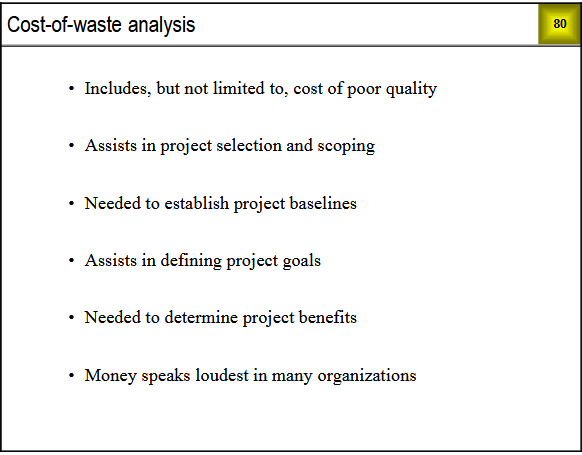
Includes:
- Cost of poor quality
- assists in project selection
- needed to establish project baselines
- Assists in defining project goals
- needed to determine project benefits
- money speaks loudest in many orgs
Apparent cost of poor quality
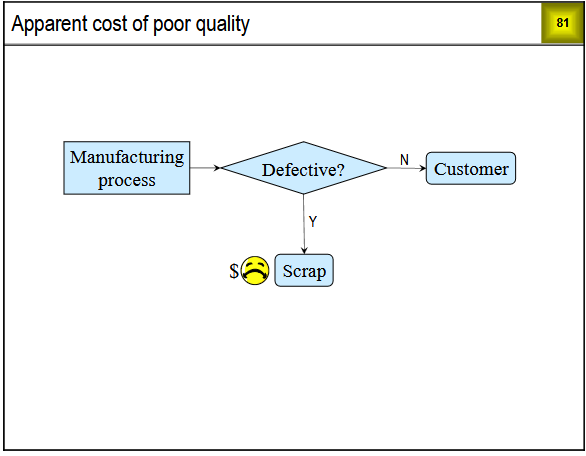
Hidden Factory
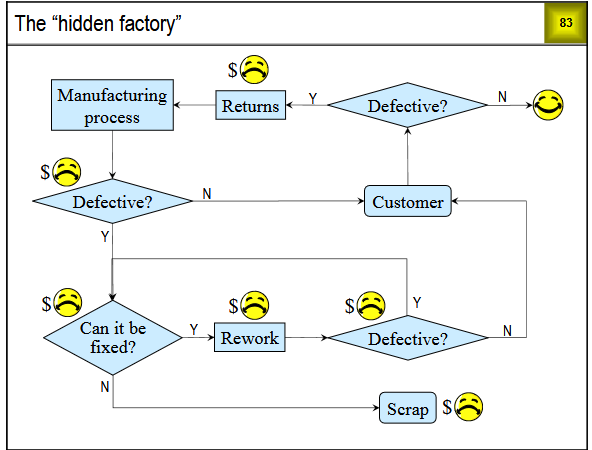
Rework loops create a "hidden factory"
No projects on hidden factory
Parts of the hidden factory
- inspections to sort good parts from the bad
- efforts to determine causes of defects
- inflating material orders and time/cost standards
- Returned goods
- service activity under warranty
- Trips to placate unhappy customers
- Loss of business due to unhappy customers
- Reworking or scrapping defective parts
- complicated inventory management
- specialized training for rework processes
- specialized rework equipment
- capacity allocated to work
- special rework qualification processes
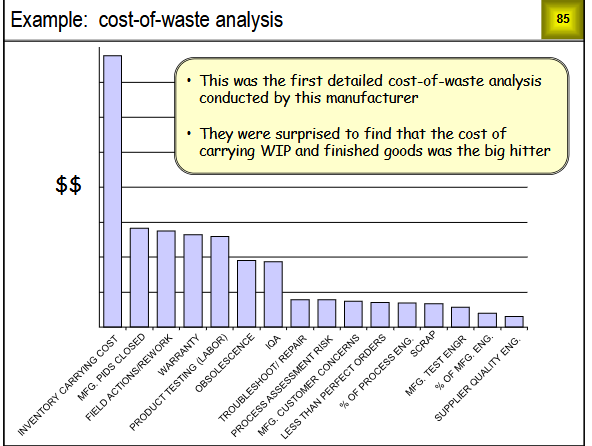
Cost of waste analysis
Costs of poor transactional quality
- Waste is harder to see in the transactional processes
- The only quantifiable cost factor is the time people spend on NVA activities
- Even if this time is reduced, there will be no actual cost reduction (unless people are laid off)
- The real benefits are:
- Reducing lead time
- Increasing Customer Satisfaction
- Increasing Capacity without additional resources
The Hidden Office
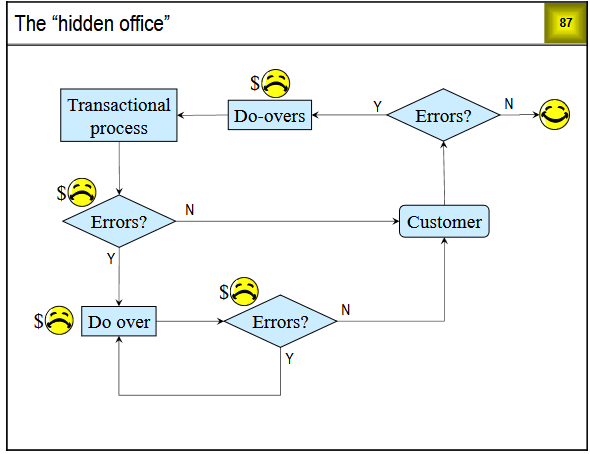
- Doing things over and over again due to errors or omissions
- Inspections to find errors and omissions
- Workarounds necessitated by root causes not being addressed
- Efforts to determine causes of errors and omissions
- Loss of business due to unhappy customers
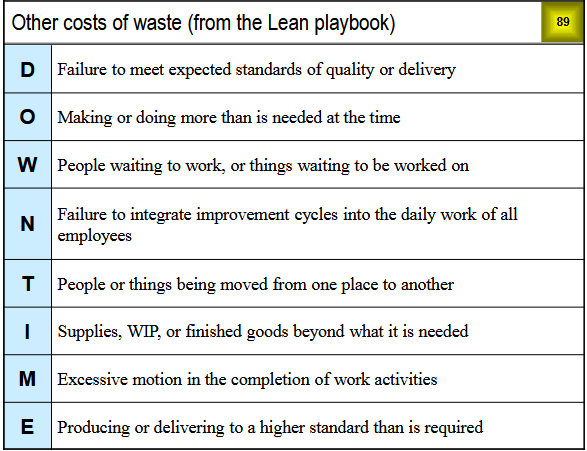
Other costs of waste (from lean playbook)
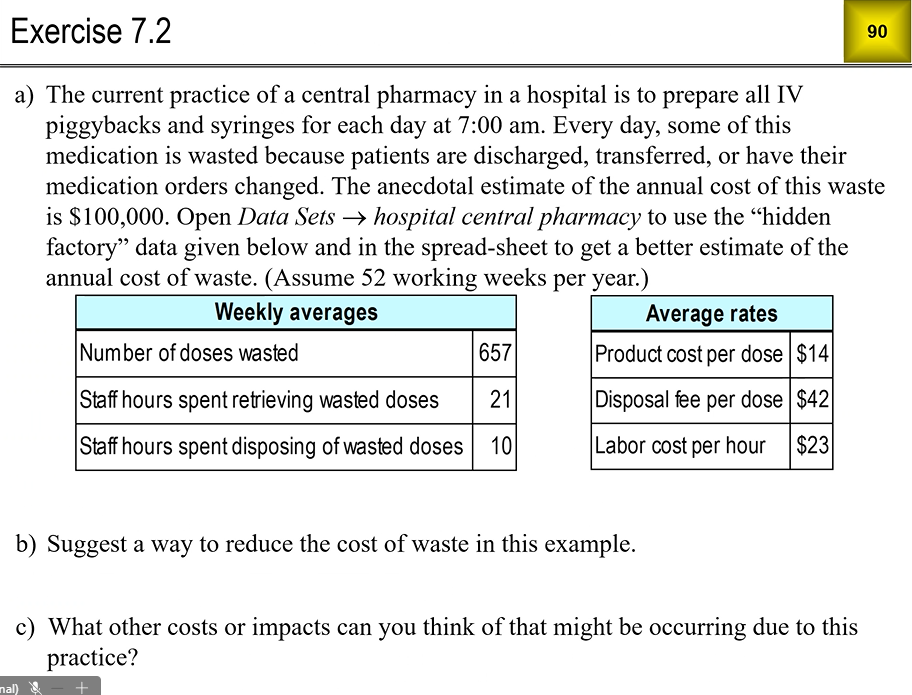
The current practice of a central pharmacy in a hospital is to prepare all IV
piggybacks and syringes for each day at 7:00 am. Every day, some of this
medication is wasted because patients are discharged, transferred, or have their
medication orders changed. The anecdotal estimate of the annual cost of this waste is $100,000. Open Data Sets → hospital central pharmacy to use the “hidden factory” data given below and in the spread-sheet to get a better estimate of the annual cost of waste. (Assume 52 working weeks per year.)
B Suggest a way to reduce the cost of waste in this example.
What other costs or impacts can you think of that might be occurring due to this practice?
A. Annual waste is actually $1,950,260.00
B. Only prepare piggybacks and syringes for partial days, use an automated dispenser, note patients that are being discharged
C. Time ordering extra medication to cover waste, Time spent prepping unnecessary piggybacks and syringes, Inventory storage costs,
From class 8/15/25
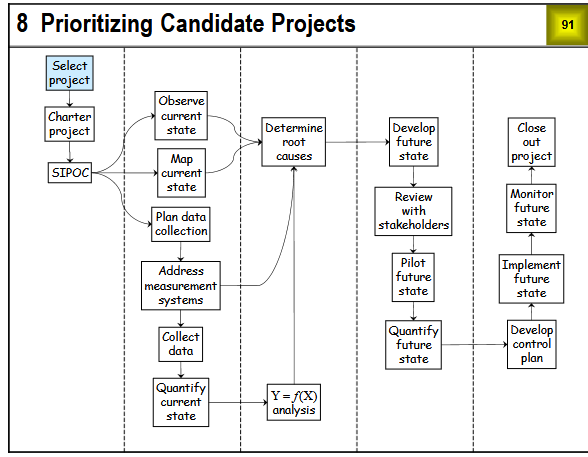
Prioritizing Candidate Projects
Qualitative description of a good improvement project
- Clearly defined problem, scope, and boundaries
- Clearly defined project metrics with baselines and goals
- Resources available, good chance of success, rapid benefits
- Aligned with business priorities
- Can complete in a reasonable amount of time
Think "SMART" Goals. Specific, Measurable, Achievable, Relevant, Time-Bound
Examples of Project Feasibility Metrics
- High likelihood of solving the problem
- Rapid completion of project
- Rapid realization of benefits
- Availability of required resources
- Availability of Data
- Process is easy to change
Sometimes people want to use cost of implementation or ease of implementation as feasibility metrics. The cost metric doesn't make sense for LSS projects because we don't know what the solution is going to be. The same can be said for the ease metric, if it refers to a solution
If on the other hand, the ease metric refers to the changeability of the in-scope workflow, then it is valid.
Measures of project impact: KPI's
- Customer satisfaction - quality, delivery, service
- Revenue, cash flow, cost of waste
- Growth in existing markets
- New market penetration
- Lack of adverse safety impact
- Lack of adverse environmental impact
An organization should use its key performance indicators to measure the probable impact of proposed improvement projects. KPIs are often established during a strategic planning process.
If your organization has a balanced scorecard, it has already taken a step towards understanding what its KPISs are. If a KPI in a balanced scorecard is defined too broadly, it will need to be broken down further to be useful in project prioritization. An example would be breaking "customer satisfaction" into separate KPIs for quality, delivery, and service.
KPIs should be define before they are used to prioritize projects. This helps people distinguish between the KPIs and the projects themselves, which in turn helps in scoping projects appropriately. For example, "reduce scrap and rework" is too broad for a project scope. A better project scope would be something like "reduce scrap and rework for product XYZ".
KPI's are supposed to reflect the priorities of the organization. As such, they should change when these priorities change, and only then.
- Open Student Files -> Blank C&E matrix - impact & feasibility.
- In the Metrics sheet, change Impact Metrics to KPIs
- List your KPIs and relative weights
- List your feasibility metrics and relative weights
- Go to the Impact Ratings sheet, change Items to be ranked to Projects
- List the candidate projects you wish to rank
- Rate each project for degree of positive impact on each KPI (by H, M, L)
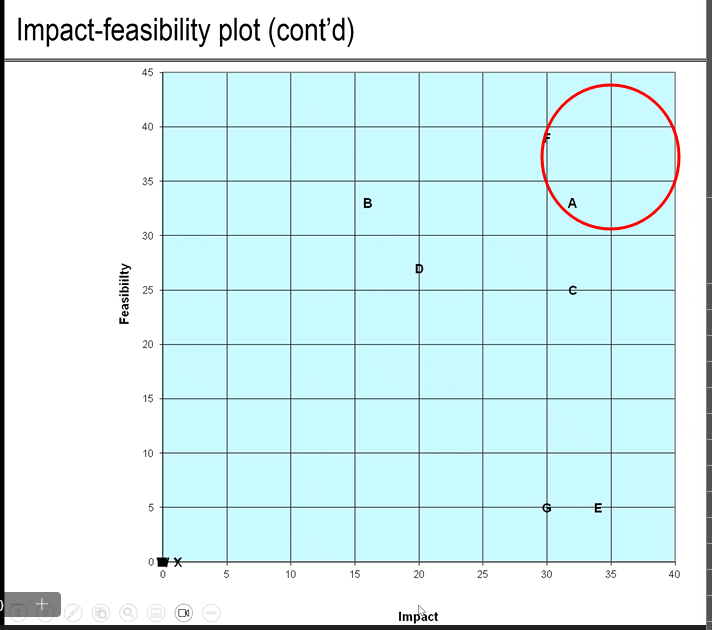
We want the upper right quadrant for projects that we choose
Chartering LSS PRojects
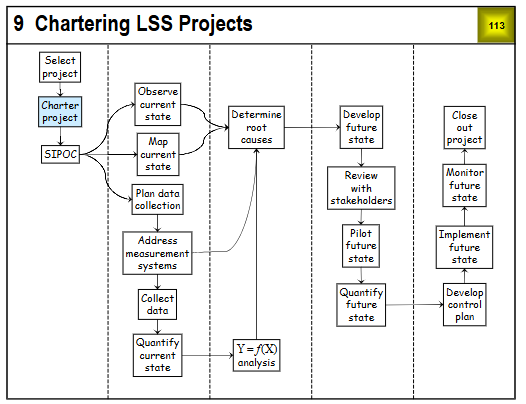
Elements of a project charter
- Project Title
- Problem and goals statements
- Value stream scope
- Workflow scope
- Constraints, concern, assumptions
- Primary project metrics, baseline values & goals, KPIs affected
- Secondary "do no harm" metrics, baseline values
- Team members and roles
- Resources and roles
- Stakeholders and their connection to the project
- Start and project review dates
Purpose of the charter
- Make the business case for the project
- define the project scope and process boundaries
- define the project metrics, give baselines and goals
- identify the project team
- identify resources for the team
- identify stakeholders affected by the project outcome
- provide a starting point for managing the project
- create buy-in and excitement
The charter must evolve with the project
- Baselines for benefit metrics may not be known initially -- update the charter when these are determined
- project scope may be modified as new information comes to light
- stakeholders may change if the project scope is modified
- additional resources may be needed to overcome unanticipated barriers
- anticipated completion dates for project reviews may have to be pushed out
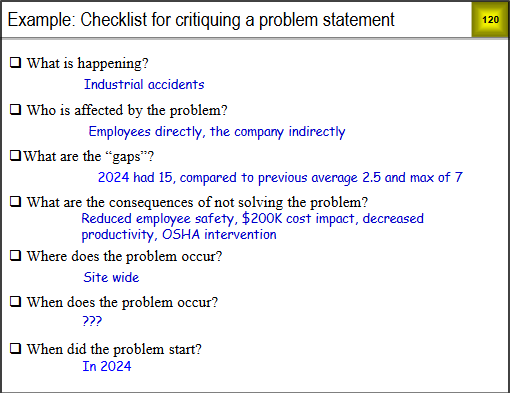
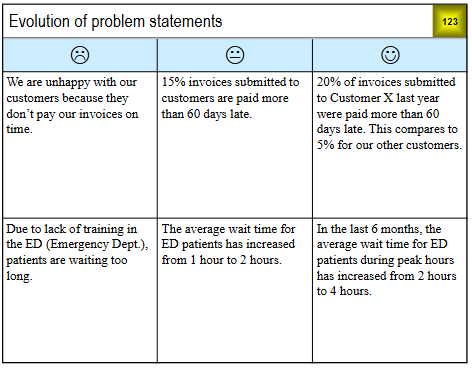
Problem Statement
- Describes the current situation in objective terms
- Does not suggest or imply solutions
- Locates the problem in time
- Can include baseline values of project metrics
- Gives enough information that people outside the team can understand what the project is about
Problem statement guidelines
- State the effect: Say who and what are affected, and how they are affected. Say what is wrong, not why it is wrong. Avoid "due to" or "because of" statements, they imply solutions
- Be specific: avoid general terms like "morale", "productivity", "communication", and "training" as they tend to have a different meaning in each person's mind. (use specific, operationally defined terms to narrow the focus to the problem at hand.
- Use positive statements: avoid "lack of" statements. Negative statements imply solutions. Do not state a problem as a question. This implies that the answer to the question is the solution
- Quantify the problem: say how much, how often, when, where. Use project metrics
- Focus on the "gaps": compare the current levels of the project metrics to the previous levels, expected levels, or desired levels. These will also be presented in the Project metrics section.
In 2024 there were 15 industrial accidents site wide. Previously, the annual average was 2.5 with at most 7 in a given year. This new level represents a significant decline in employee safety. If it continues, we will see a $200,000 increase in annual costs, and substantially decreased productivity.
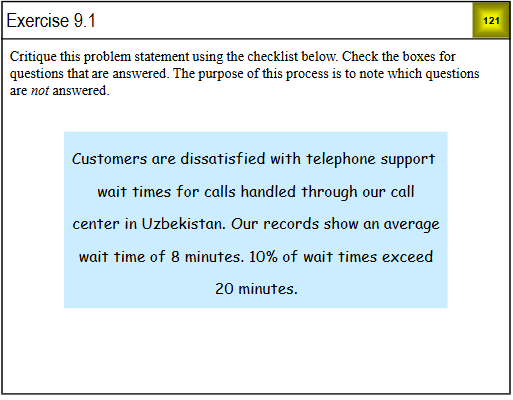
- Dissatisfaction due to long wait times
- customers
- what an acceptable wait time might be
- Uzbekistan call center
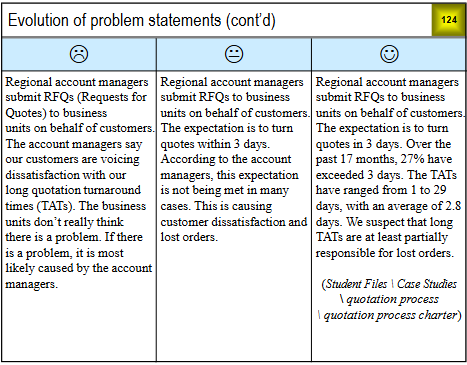
As our business has grown over the years, our tool development process has become a major problem. The primary customer complaint is that our order-to-sell time is too long. This is caused primarily by large numbers of tool rework cycles. Over the past year, the number of reworks per tool ranged from 0 to 18. The order-to-sell time ranged from 3 to 57 days. The rework cost per tool ranged from 0 to $32,400. We cannot compete on price with our Chinese competitors, so our only hope is to compete on quality and lead time.
A secondary problem is that many of the tools released to manufacturing from the current testing process require slow line speeds and high material weight.
“Alpha case” is an oxidation layer commonly found on titanium castings in the as-cast condition. It must be removed by chemical milling. Alpha case is measured by chemical analysis of coupons taken from the castings. The upper specification limit for O2 is 200 PPM. Over the past six months, post-milling O2 levels on large titanium castings have gradually trended upward. It has become common practice to send castings back for one or more extra chemical mills to bring the O2 below 200. Each extra cycle reduces our profit margin by $TBD and adds TBD days to the lead time.
In the past two months, repeated chemical milling has failed to solve the O2 problem for increasing numbers of castings. Instead, these castings are scrapped for dimensional nonconformance. This has resulted in scrap costs of about $400,000 per week, and has severely hindered our ability to meet delivery schedules.
a. Write a problem statement for the project you and your team currently have in mind. Leave blanks for metrics, as needed
Write a critique of the problem statement you receive from another team
revise your problem statement in light of the other team's comment
- Customer D
- during FAI we had all passing units. Now we are seeing about 10% of units failing
- lower yield, customer dissatisfaction
- during verify
- at all times during verify
- after segment 2
Problem Statement
After completion of the 110 Segment 2 process, the rate of gyro misalignment failures increased from 0% during Segment 2 to approximately 10% during Segment 3. This misalignment occurs consistently during verification testing, requiring rework of affected units. The resulting lower yield and rework time are causing shipment delays for Customer D and risk customer dissatisfaction.
Goal Statements
- reduce the number of reworks per tool by 50%
- Meet the 3-day turnaround time (TAT) expectation 95% of the time
- Achieve a level of 200 PPM or less for all castings after the first chemical milling
- Complete all first project reviews within the 10-day expectation
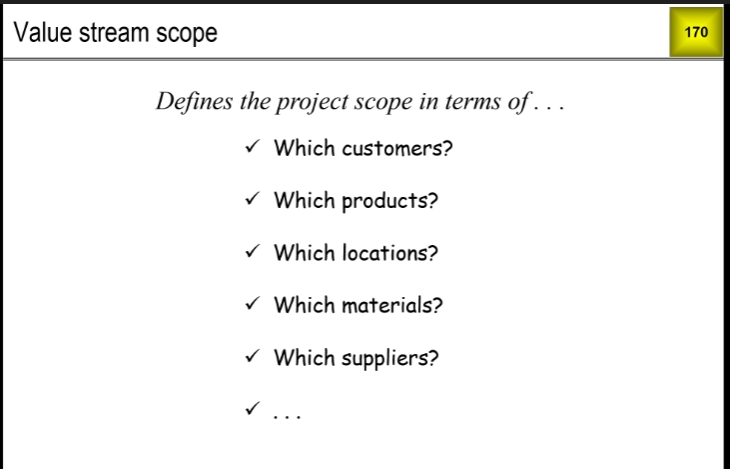
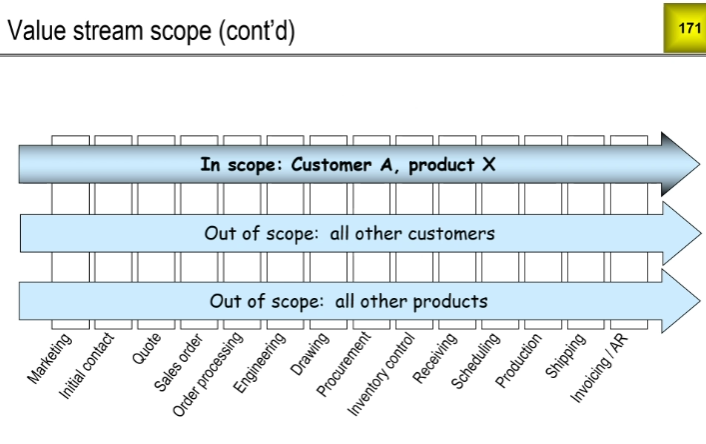
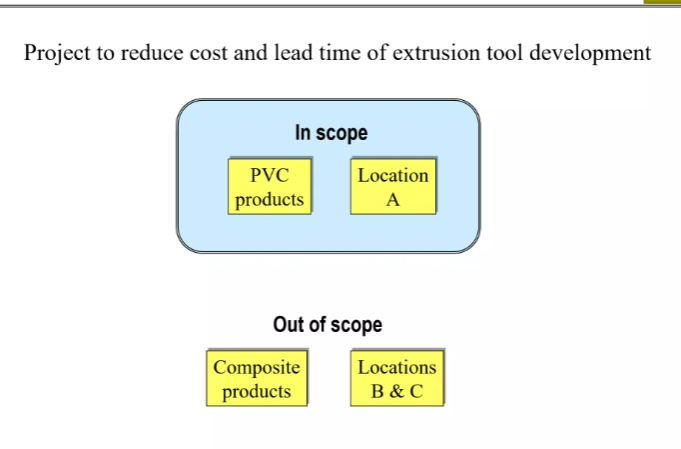
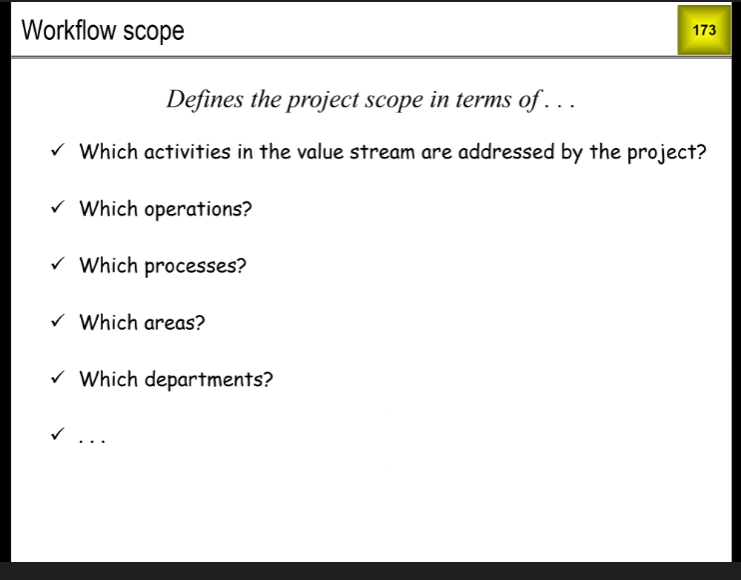
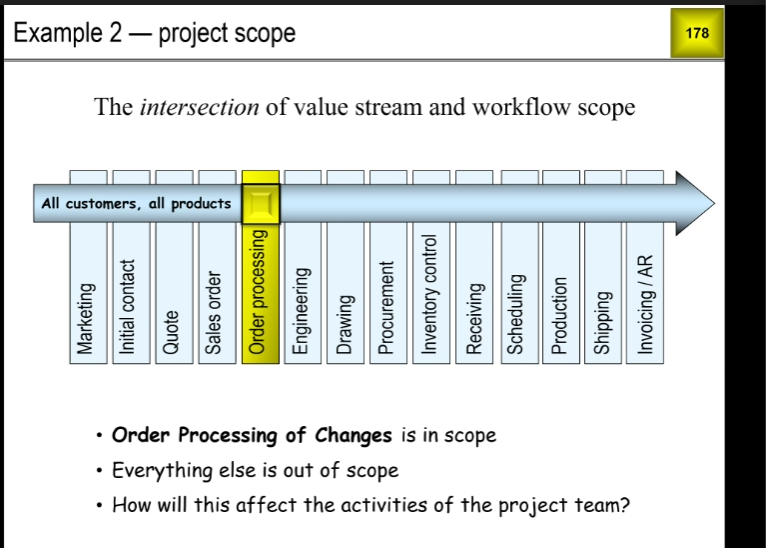
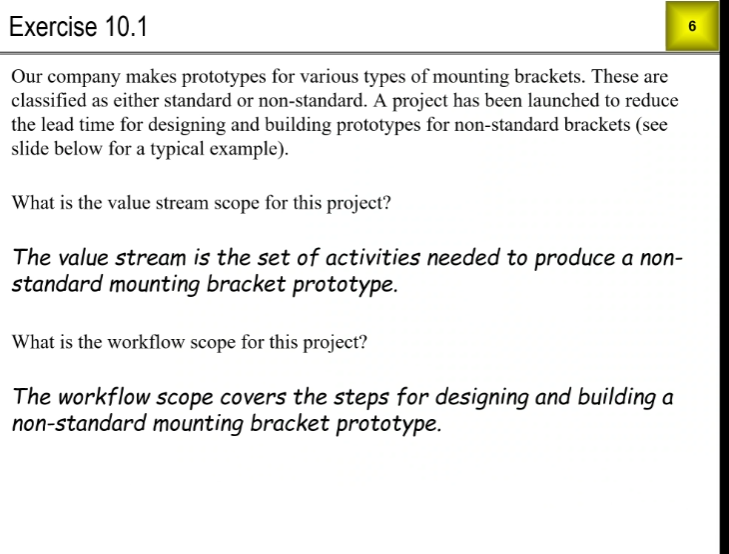
Project Scope
2 Dimensions:
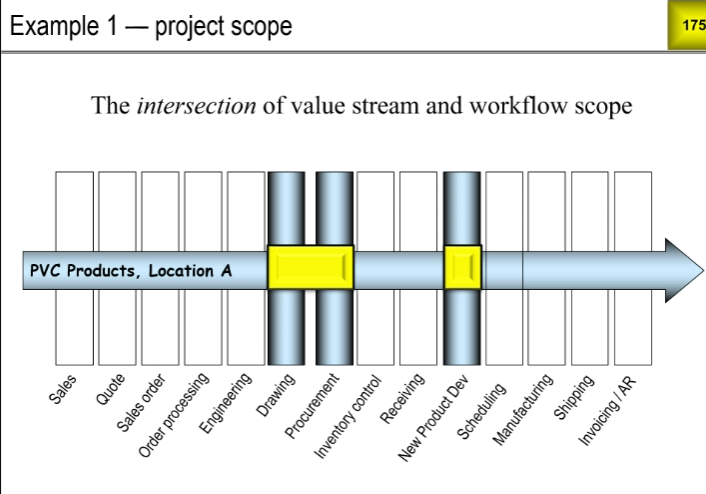
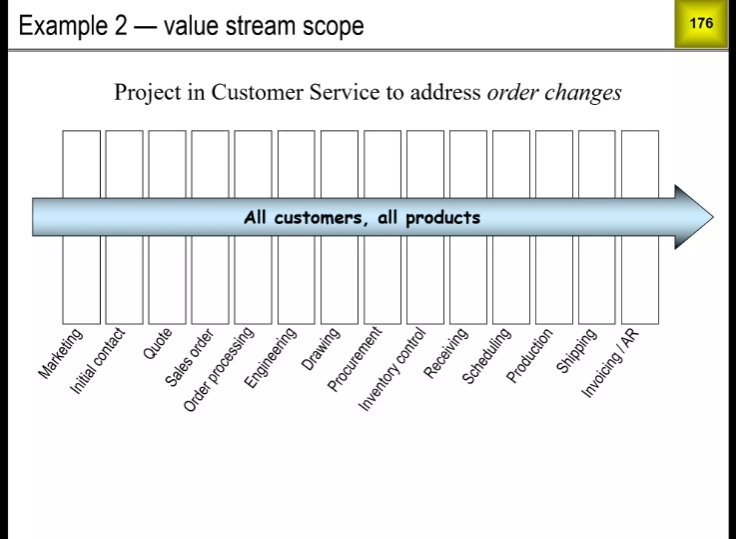
- Value Stream Scope:
- Which customers
- which products
- which services
- which locations
- which suppliers
- which materials
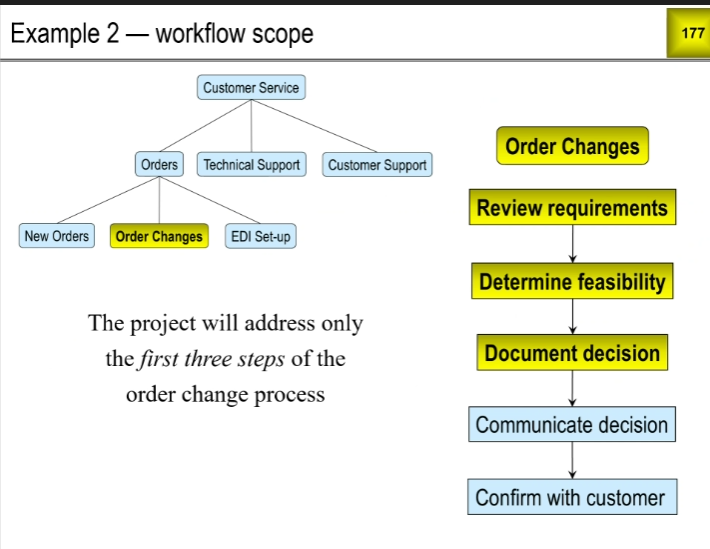
- Workflow Scope
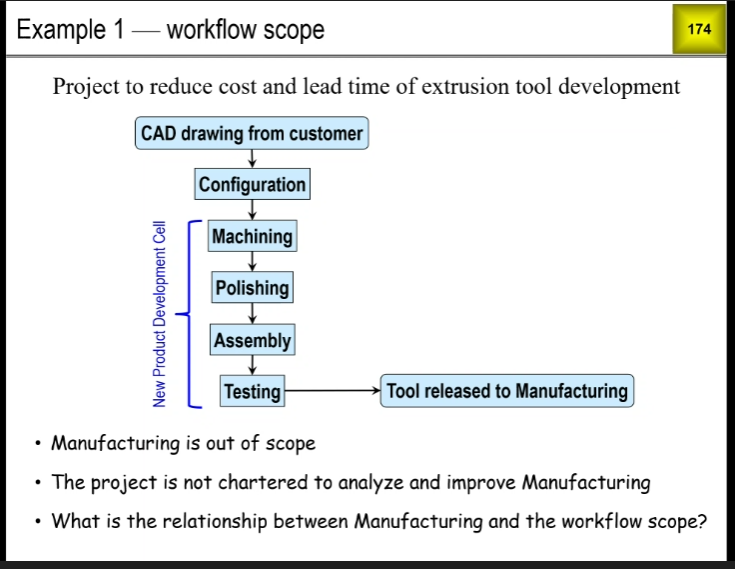
- Starts with an RFQ from the customer, ends with an approved quote or request to modify the RFQ
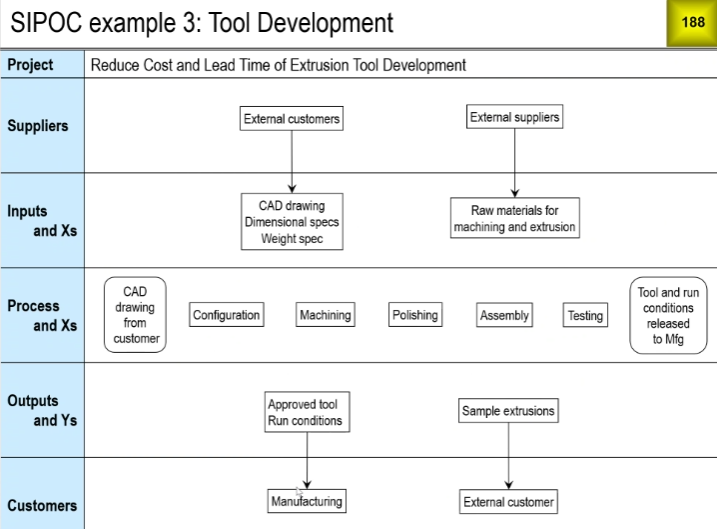
- Starts with the receipt of a CAD Drawing from the customer, ends with an approved tool and run conditions released to manufacturing.
- Starts with ceramic slurry makeup, ends with a finished coating
- billing, payment, adjustment, collection
- order processing, fulfillment, costing
Constraints
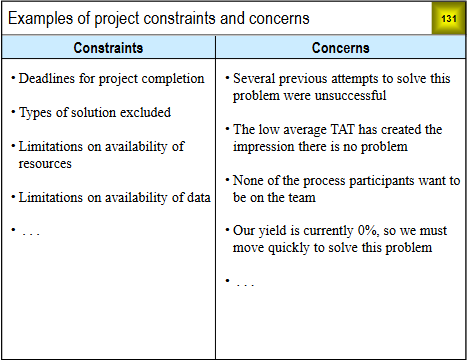
Example project assumptions
- How often the team will meet
- how long the meetings will be
- time to be spent on the project by each team member
- roles and responsibilities of the team members
- in scope solutions will apply to out of scope areas
- will be able to get some process participants on the team
- we will engage stakeholders and convince them to support the project
Project Metrics
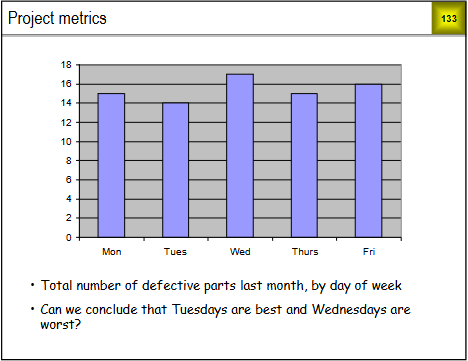
Categories of Project Metrics
The three main categories of project metrics are:
- quality
- delivery
- cost
It is recommended that your primary metric be a Quality or Delivery metric, in order to keep your project focused on the process
With process improvement, costs will follow
| If your primary metric is | Secondary metrics to consider are |
|---|---|
| Quality (defects, scrap, rework, etc) | Delivery and Cost |
| Delivery (time to complete, on-time, delivery, etc.) | Quality and Cost |
| Cost | Quality and Delivery |
Examples of project Metrics
| Statistic | Data needed to calculate statistic |
|---|---|
| Avg number of reworks | numbers of reworks for n tools |
| avg order time to sell | order to sell times for N tools |
| PO hit rate | PO (yes or no) for N quotes |
| %TAT > 3 | TAT >3 for N quotes |
| Avg. TAT | Turnaround times for N quotes |
| %O2 > 200 | O2 >200(yes or no) for N castings after first chem mill |
| Avg. O2 | O2 levels for N castings after first chem mill |
Project metrics MUST BE linked to KPIs
Define the primary metric for the project you currently have in mind. Describe the data that will be needed to calculate it and give the formula by which it will be calculated
Metric:
Data needed. Number of units tested, number of units failing
Define secondary metrics for the project you currently have in mind. Describe the data that will be needed to calculate them, and give the formula by which it will be calculated
Average number of units delivered on time per PO
Day 3 8/28/25
Quiz
a. We implemented a proposal to increase revenue, but it didnt work
b. This staff member consistently receives poor performance evaluations
c. There is a feasible future state in which we could deliver this product or service without having to do this activity.
d. our top management team is incapable of making good decisions
C?
a. O and T
b. O and I
c. T and I
d T and M
d. T and M, transportation and motion (look up downtime)
a. Optimizing the value-adding portions of the workflow
b. reducing the non-value adding portions of the workflow
c. firing employees with consistently poor performance.
d. promoting employees with consistently good performance
b. Eliminating waste usually delivers the biggest gains in cost, lead time, and throughput; optimizing value-add steps gives smaller, incremental improvements, and c/d don’t address the process.
a. A live video you can watch on the internet.
b. a steady flow of orders for your products or services
c. a department specializing in one particular step in a mfg or service process
d. the set and sequency of all activities required to produce or deliver a specified family of products or services to the customer
D
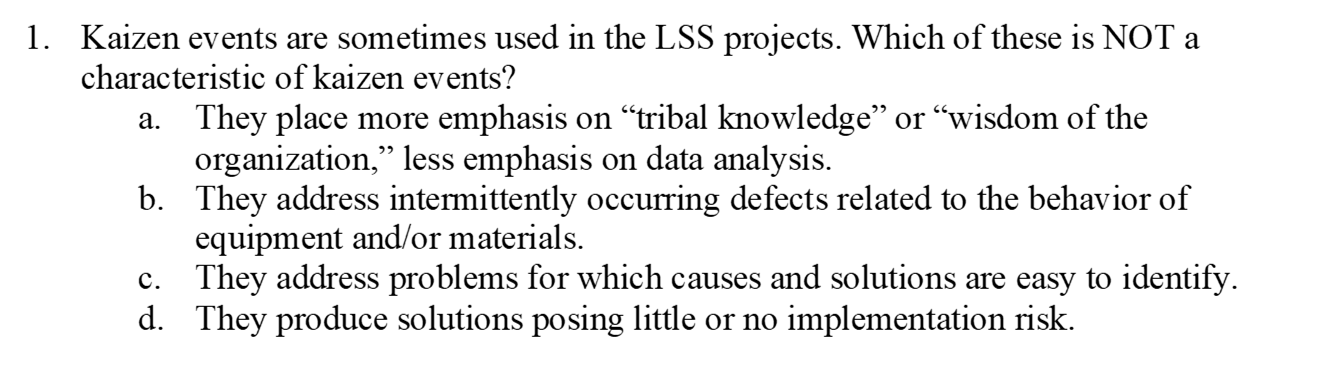
b. They address intermittently occurring defects related to equipment/material behavior.
Kaizen events focus on obvious wastes with clear causes and low-risk fixes using team knowledge; sporadic/complex defects need deeper Six Sigma analysis, not a kaizen blitz.
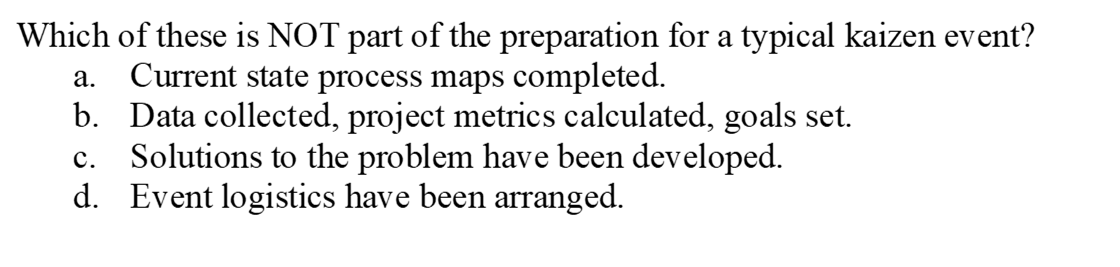
c. Solutions to the problem have been developed.
Solutions are created during the kaizen event; prep covers scope, baseline data/metrics, current-state mapping, and logistics.
b. Not putting a control plan in place to sustain the gains after the event.
That’s a classic failure—without standard work/metrics/ownership, improvements backslide. The other options are good practices, not pitfalls.
d. 94% — Rolled Throughput Yield = 0.99 × 0.98 × 0.97 = 0.9411 ≈ 94%.
a. Customers care more about defective units (DPPM) than DPMO.
b. DPMO needs a discrete count of defect opportunities; without it, you can’t compute DPMO.
a. Champions sponsor projects, provide resources, and remove barriers.
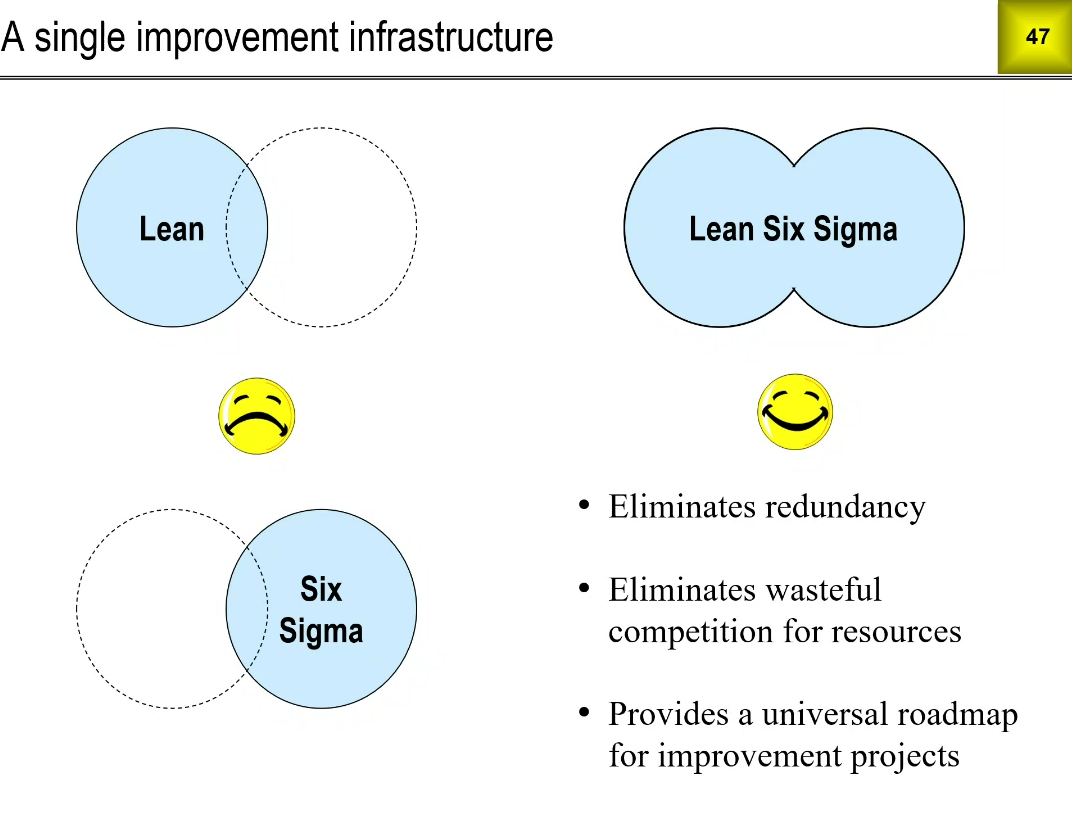
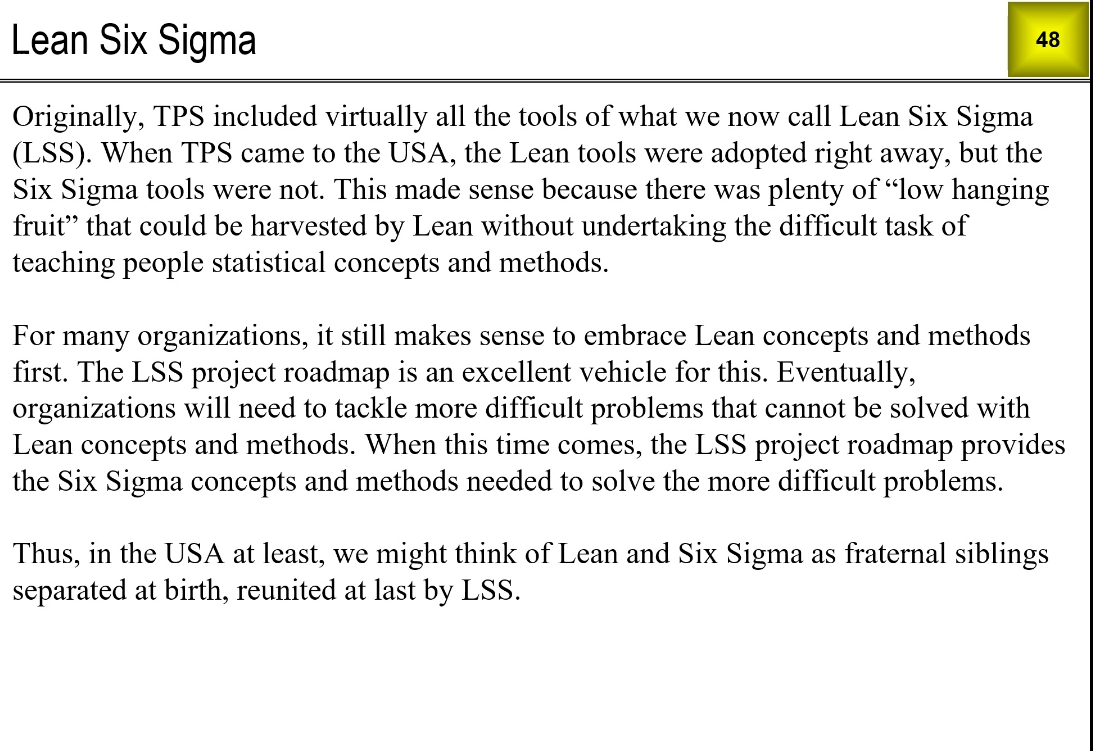
Lean and Six Sigma are distinct; they’re combined because their tools and focus areas complement each other.
a. Posters/slogans aren’t essential; culture, teamwork, and frontline engagement are.
b. Succession planning is primarily an HR/leadership pipeline activity; the others tie directly to LSS.
a. Executives sponsor, set KPIs, and select/prioritize projects; Belts lead the teams.
c. Limiting WIP is about focus and throughput—not letting people opt out.
d- Purchase a new machine.
a — Reduce machine setup time.
d — Not the same as COPQ.
b — Impact × feasibility analysis.
c — Stakeholder “feelings” don’t belong.
a — Don’t pre-bake the solution.
a — Raw counts (last year) ≠ good metric.
c — “Largest” (max) is unstable as a KPI.
Lecture
-
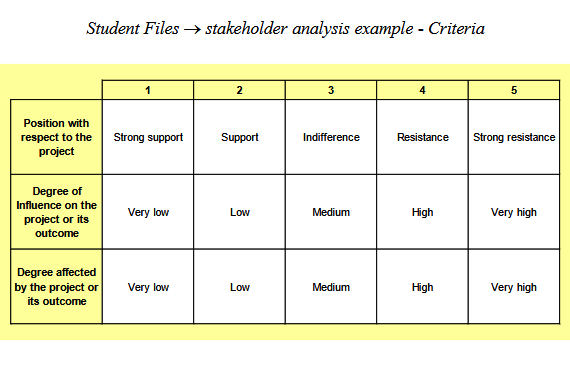
Stakeholder, anyone with a vested interest in the project or its outcome who provide the team with their point of view on the project and its potential impacts
Science of team development
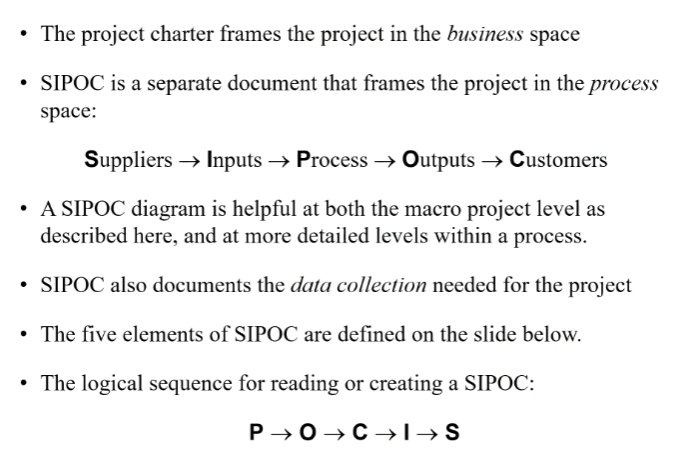
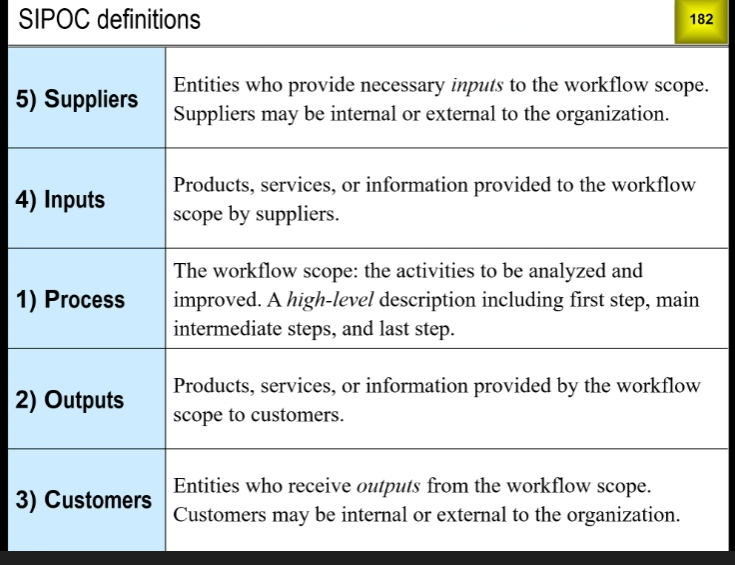
Project Scope
SIPOC
Suppliers, Inputs, Process, Outputs, Customers
Day 4 8/29/25
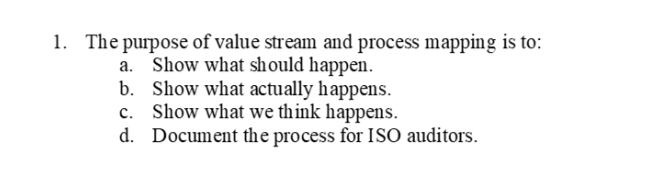
Process Map
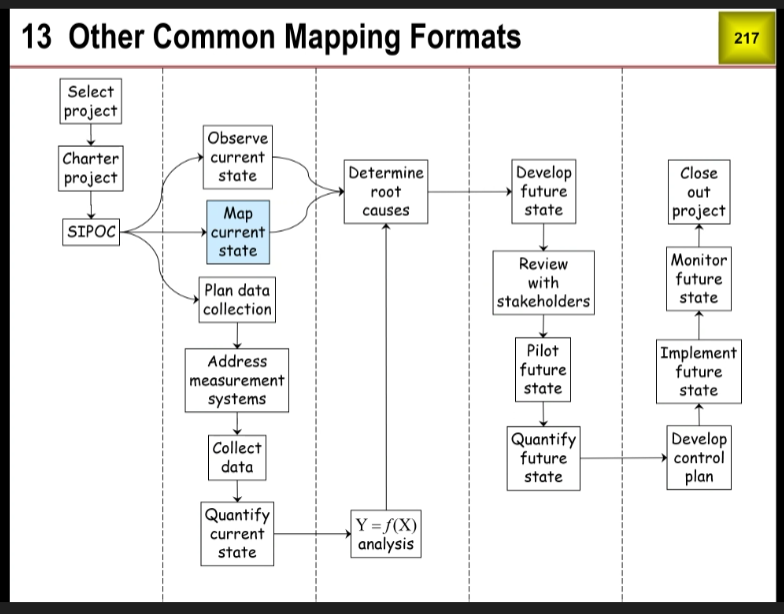
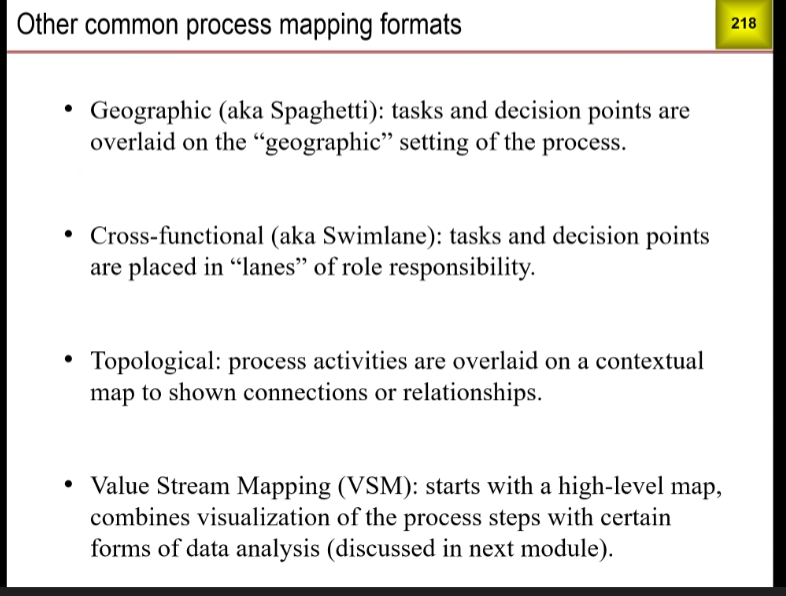
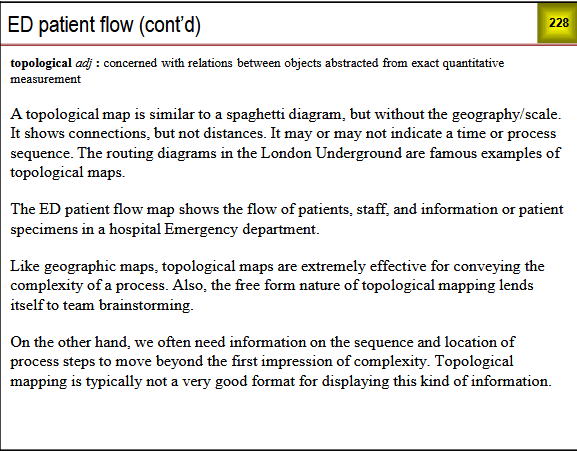
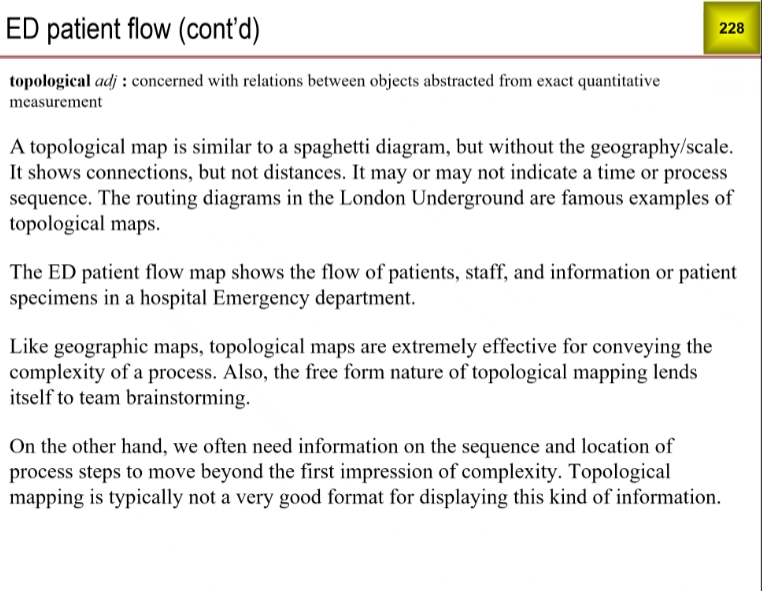
Other Common Process Mapping Formats
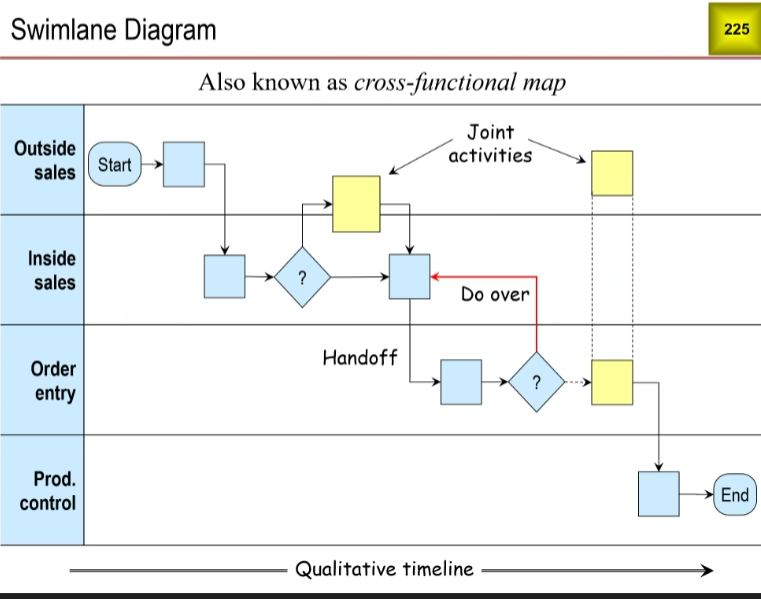
- Geographic: tasks and decision points are overlaid on the geographic setting of the process
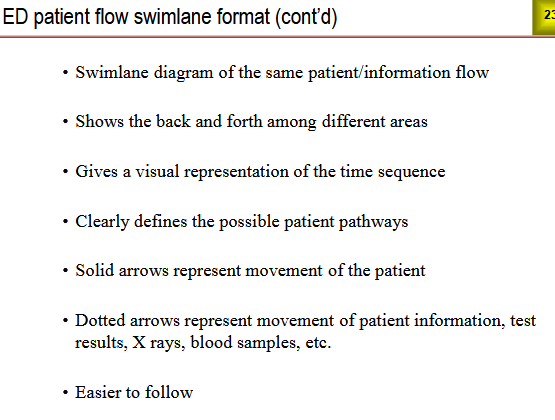
- Cross-functional (aka swimlane): tasks and decision points are placed in "lanes" of role responsibility
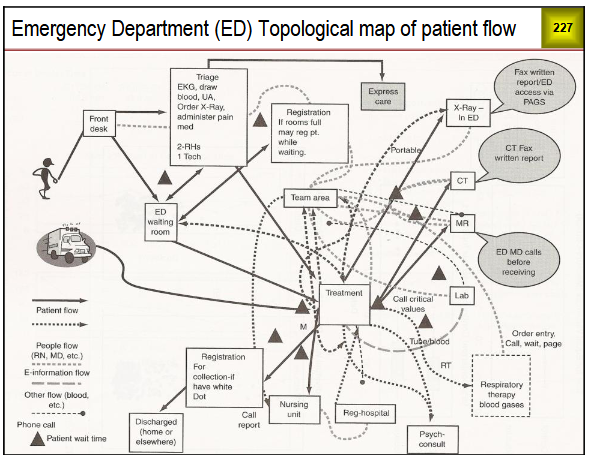
- topological: prcoess activities are overlaid on a contextual map to show connections and relationships
- Value Stream Map: starts with a high level map, combines visualization of the process steps with certain forms of data analysis
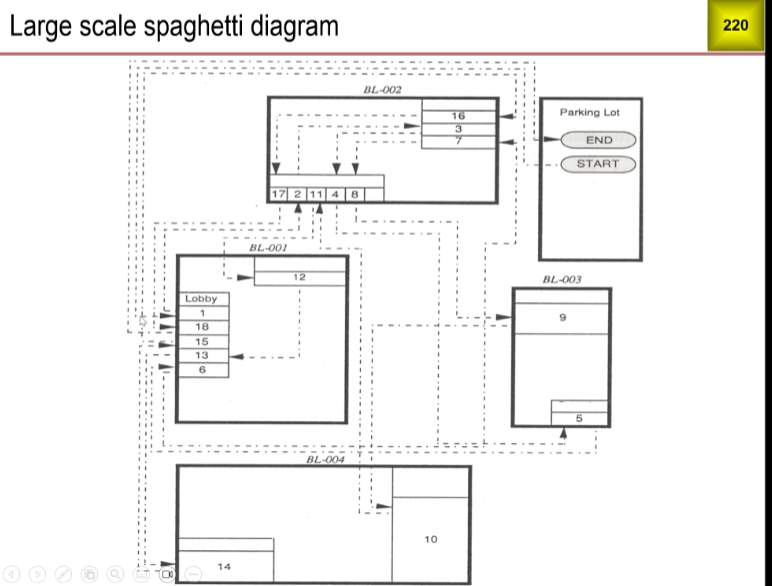
Spaghetti Diagram
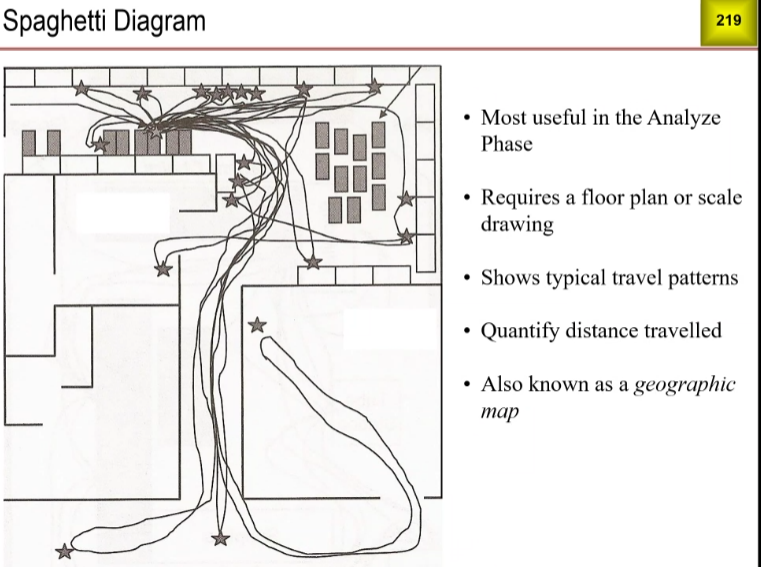
- Most useful in the analyze phase
- requires a floor plan or scale drawing
- shows typical travel patterns
- quantify distance traveled
- also known as a geographic map
Swimlane Diagram
Topological Map
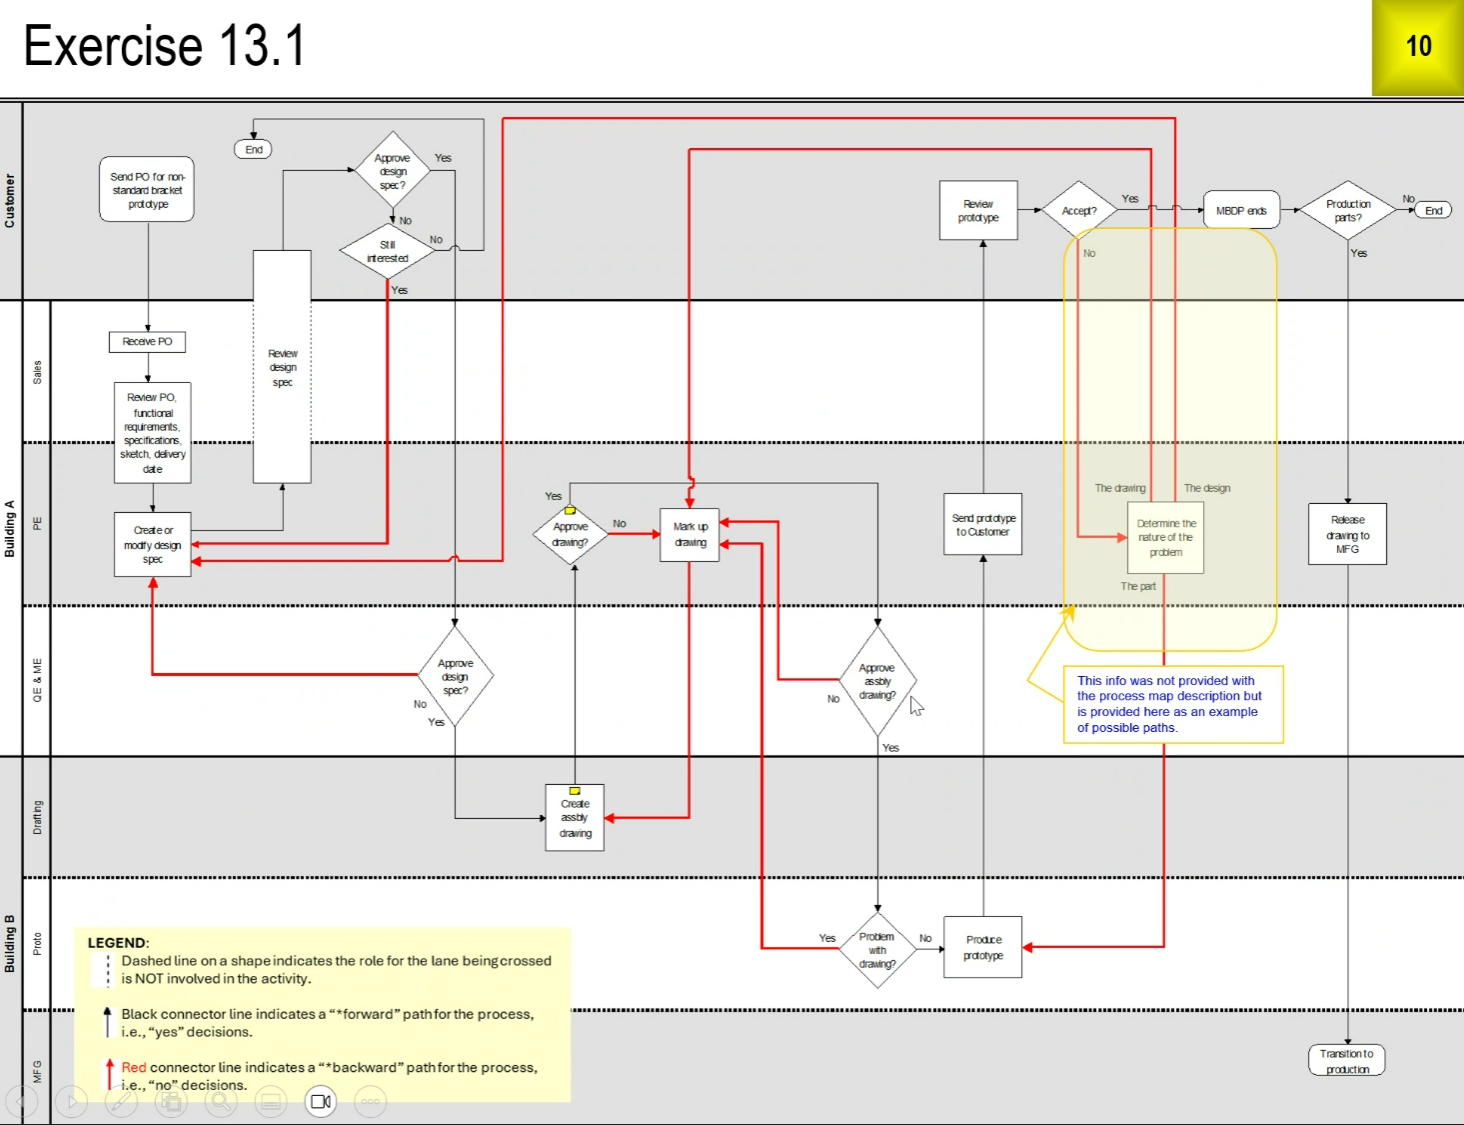
Exercise 13.1

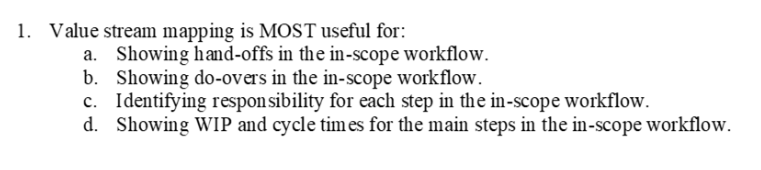
Value Stream Mapping
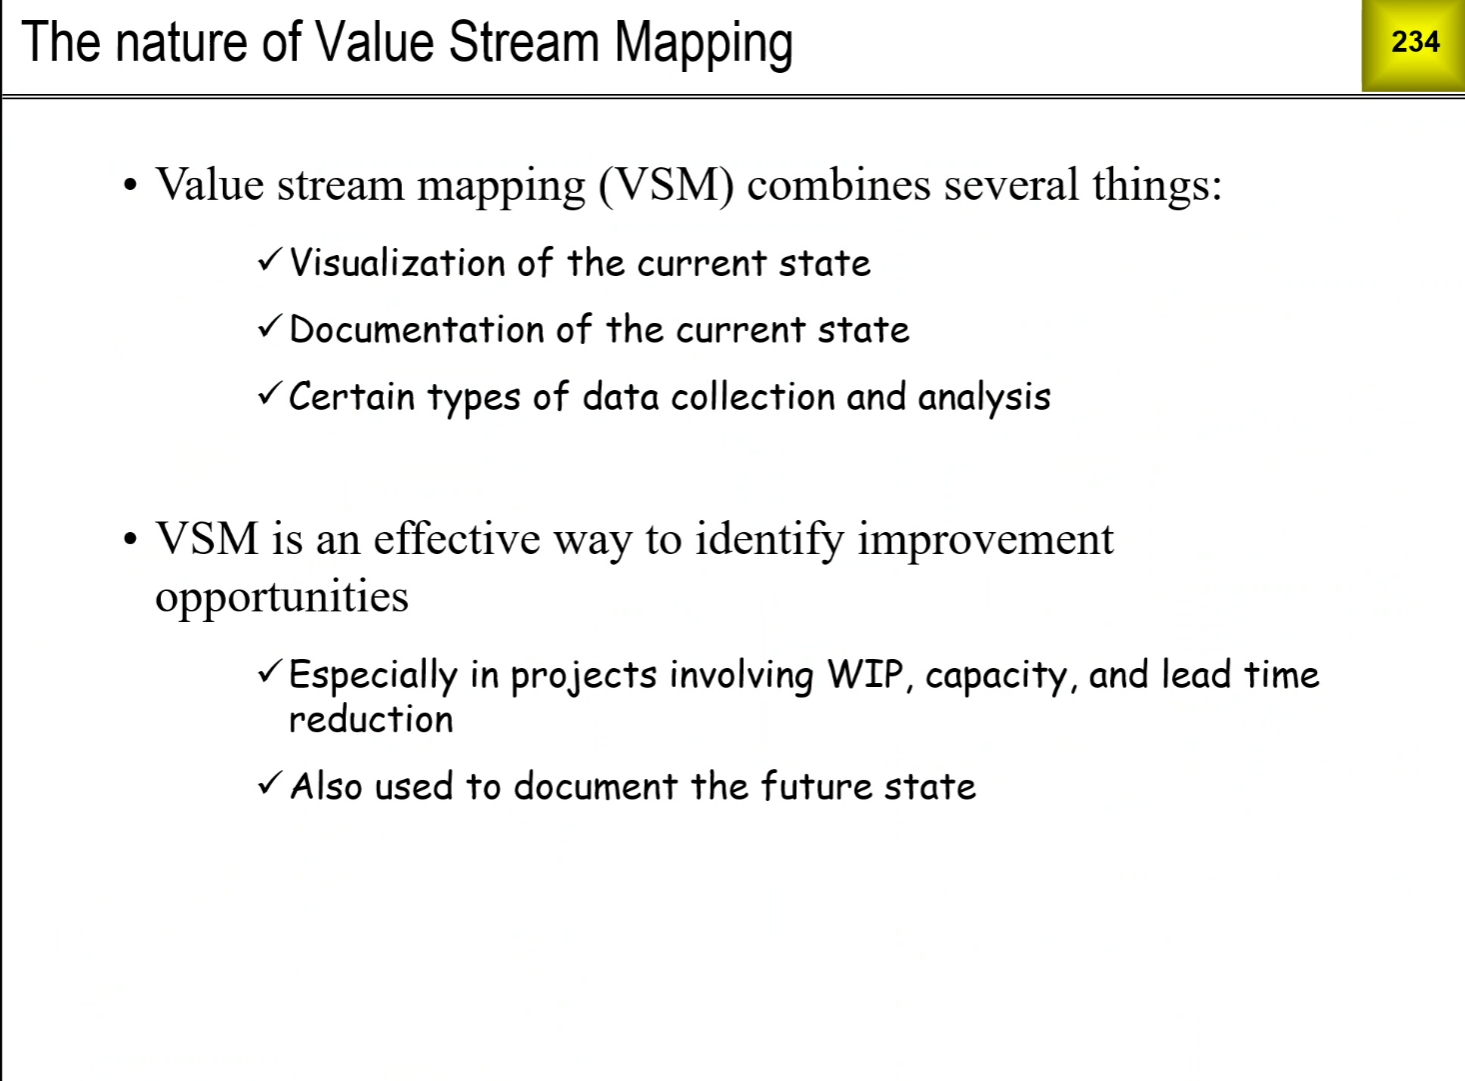
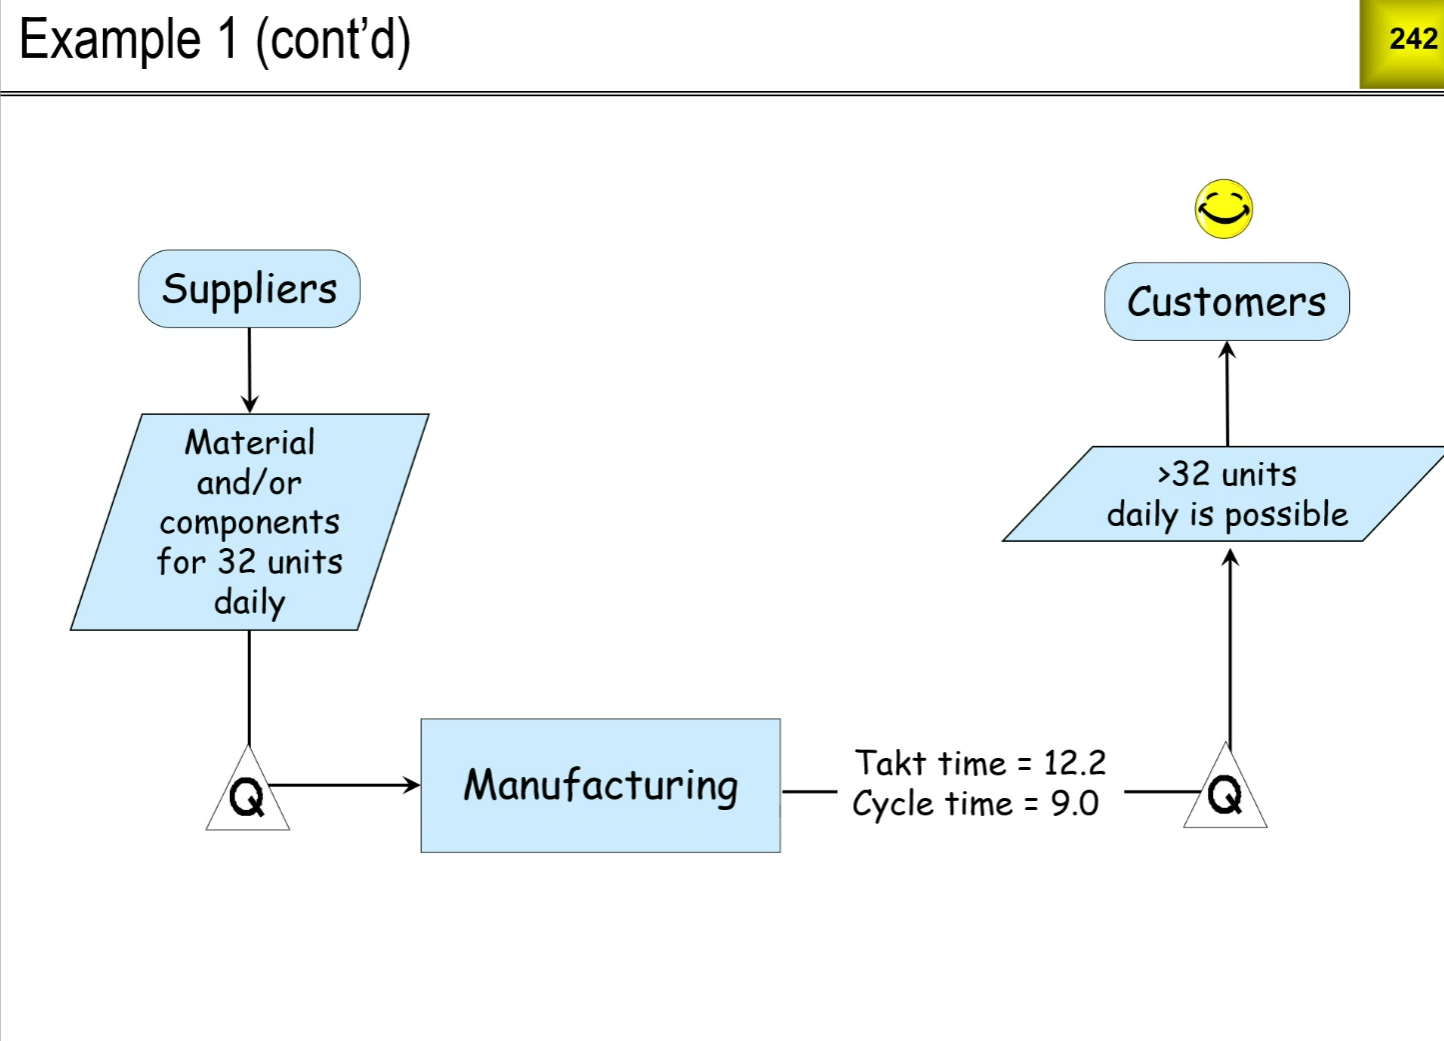
From SIPOC to VSM
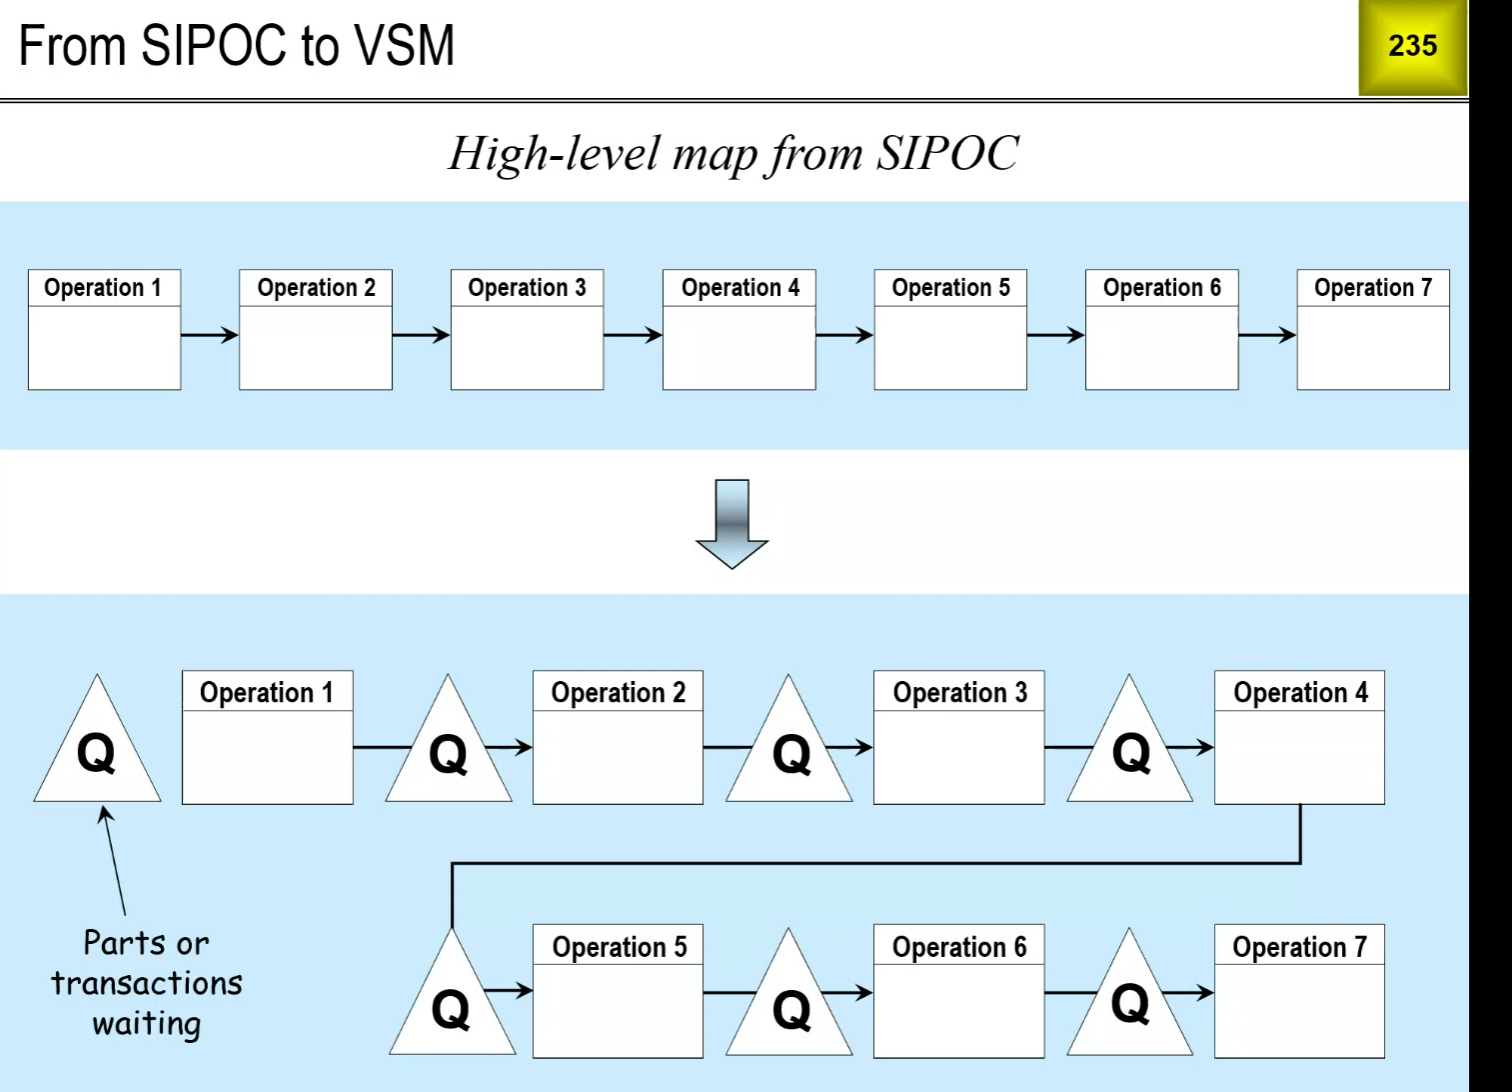
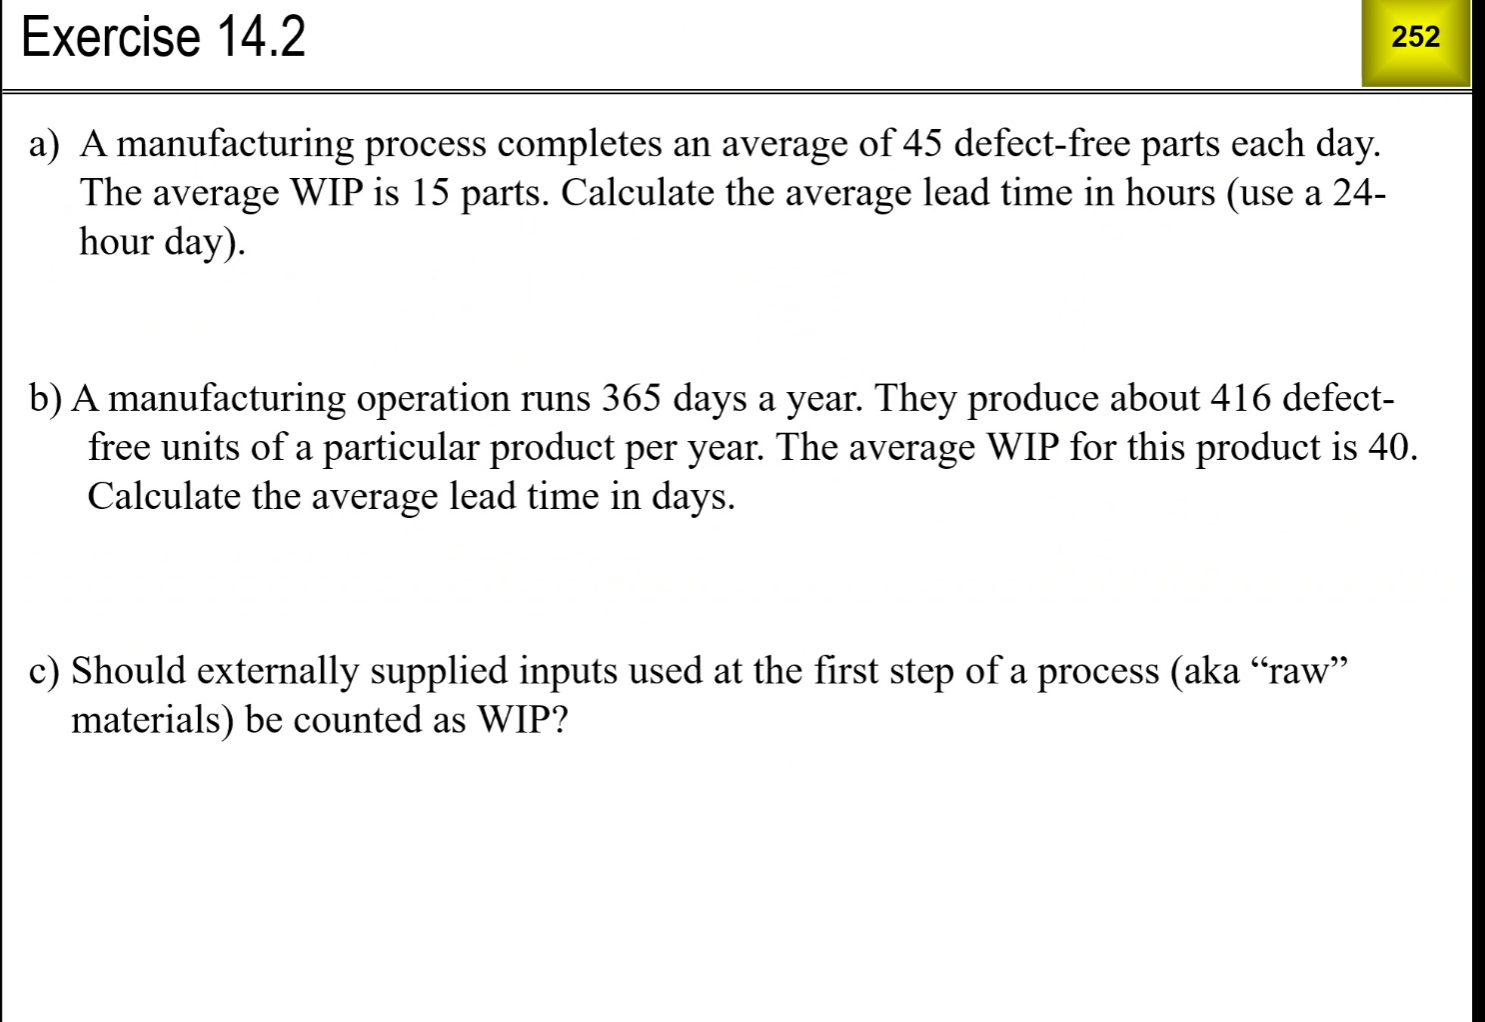
- Available working time: the time a process is available to conduct work
- Throughput: average number of good parts or transactions completed over a period of time
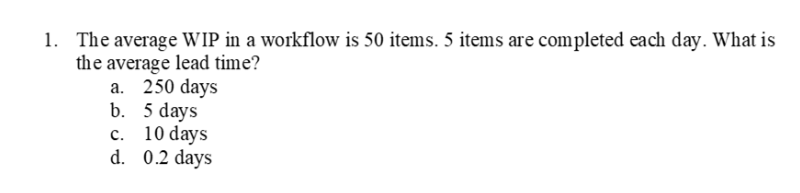
- Lead Time: The total elapsed time to produce one defect free product or transaction, or the time difference between when a part or transaction enters and leaves a process
- Customer Demand Rate: The number of parts or transactions that the customer desires over a period of time
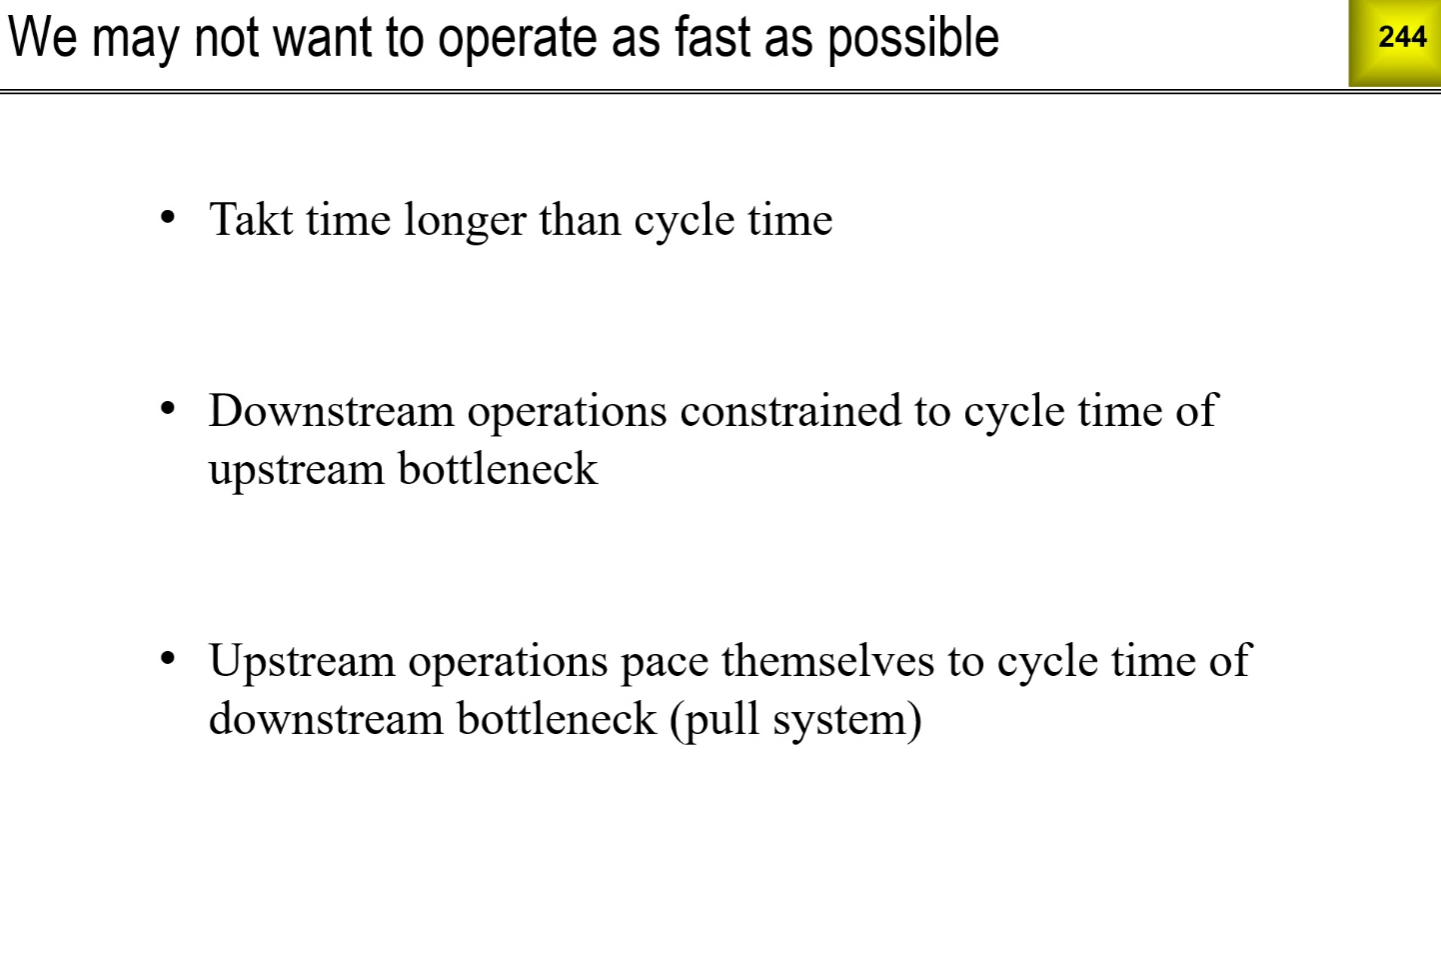
- Takt time: the pace at which an operation should complete products or transactions in Order to meet customer demand during the Available working time
- Cycle Time: the fastest repeatable time between part or transaction completions using the current processes and resources
- Process cycle efficiency: the percentage of time that WIP is being transformed by Value Added Activities. In other words, the percentage of lead time that is value added
- Work In Progress (WIP): includes item waiting to be worked on and items actively being worked on
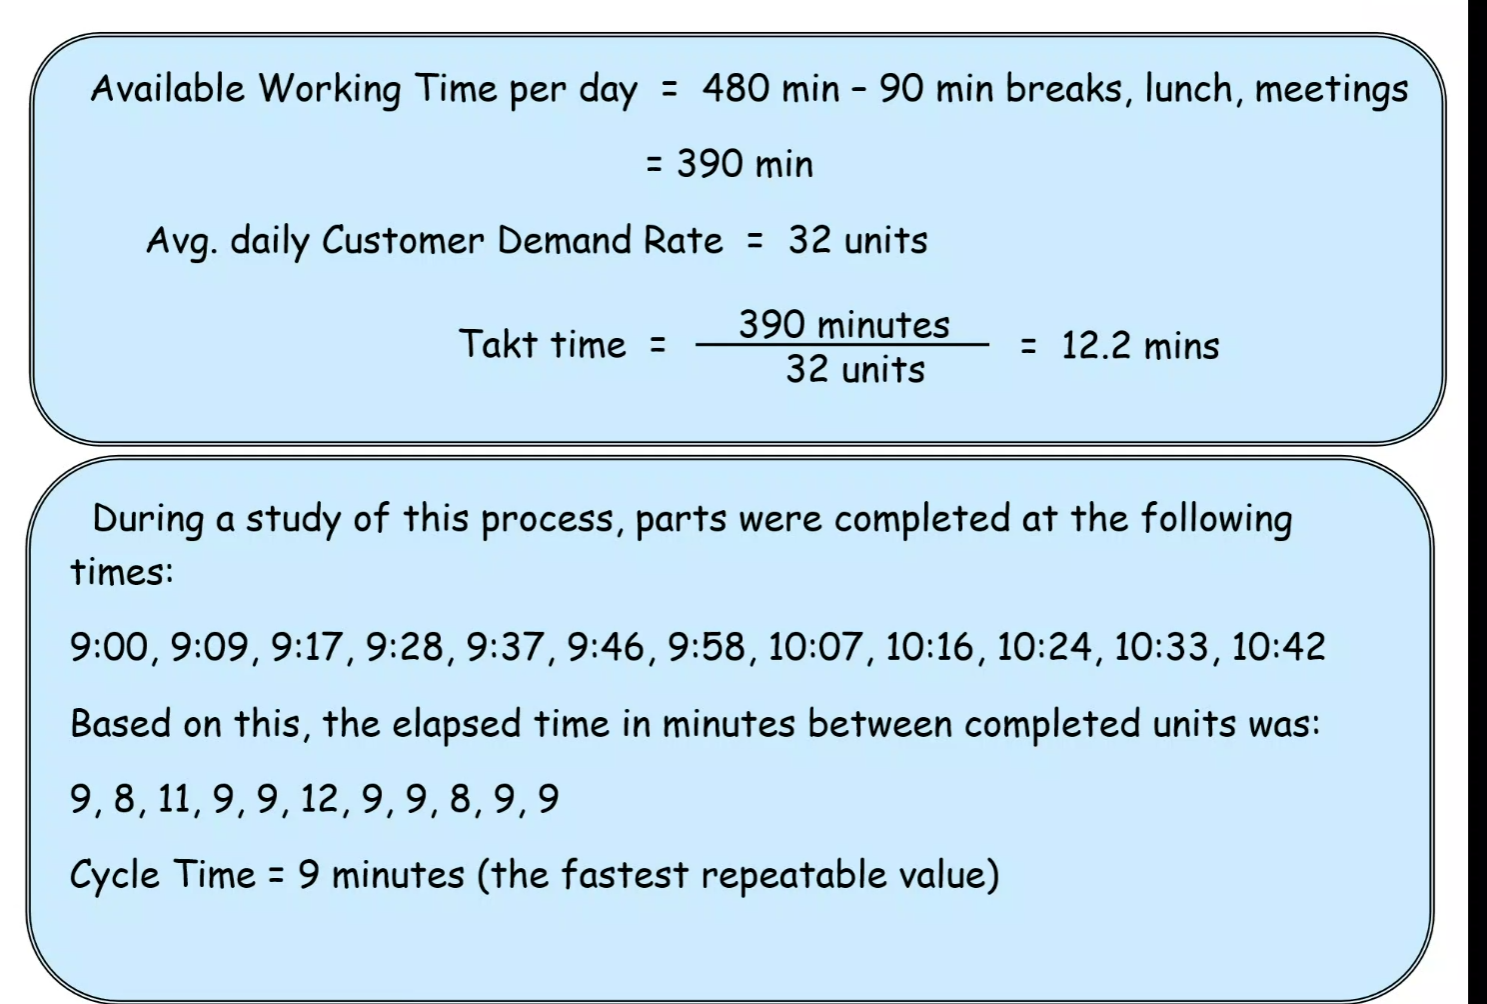
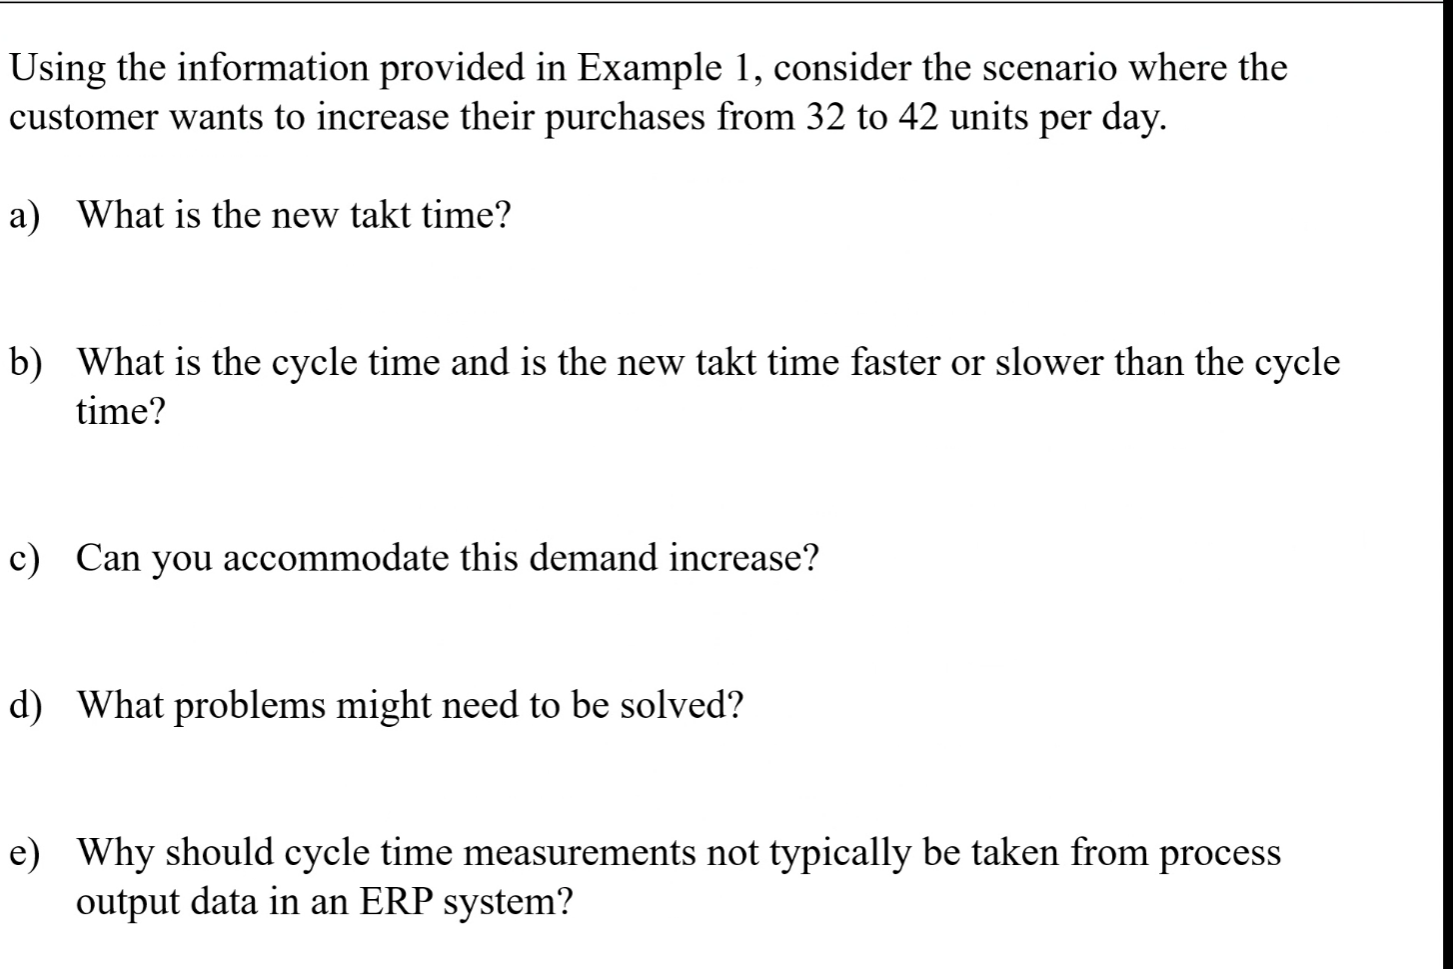
- What is the new TAKT time? 9.285
- What is the cycle time? 9 min for cycle time (based on prompt) TAKT time is slower than cycle time
- Can you accommodate this demand increase? Yes, we can accomodate it, barely
- Eliminate variation in process
- ERP's are taken from production data, but it can't account for incorrect inputs
How do we get lead time data?
[[Pasted image 20250829104023.png]]
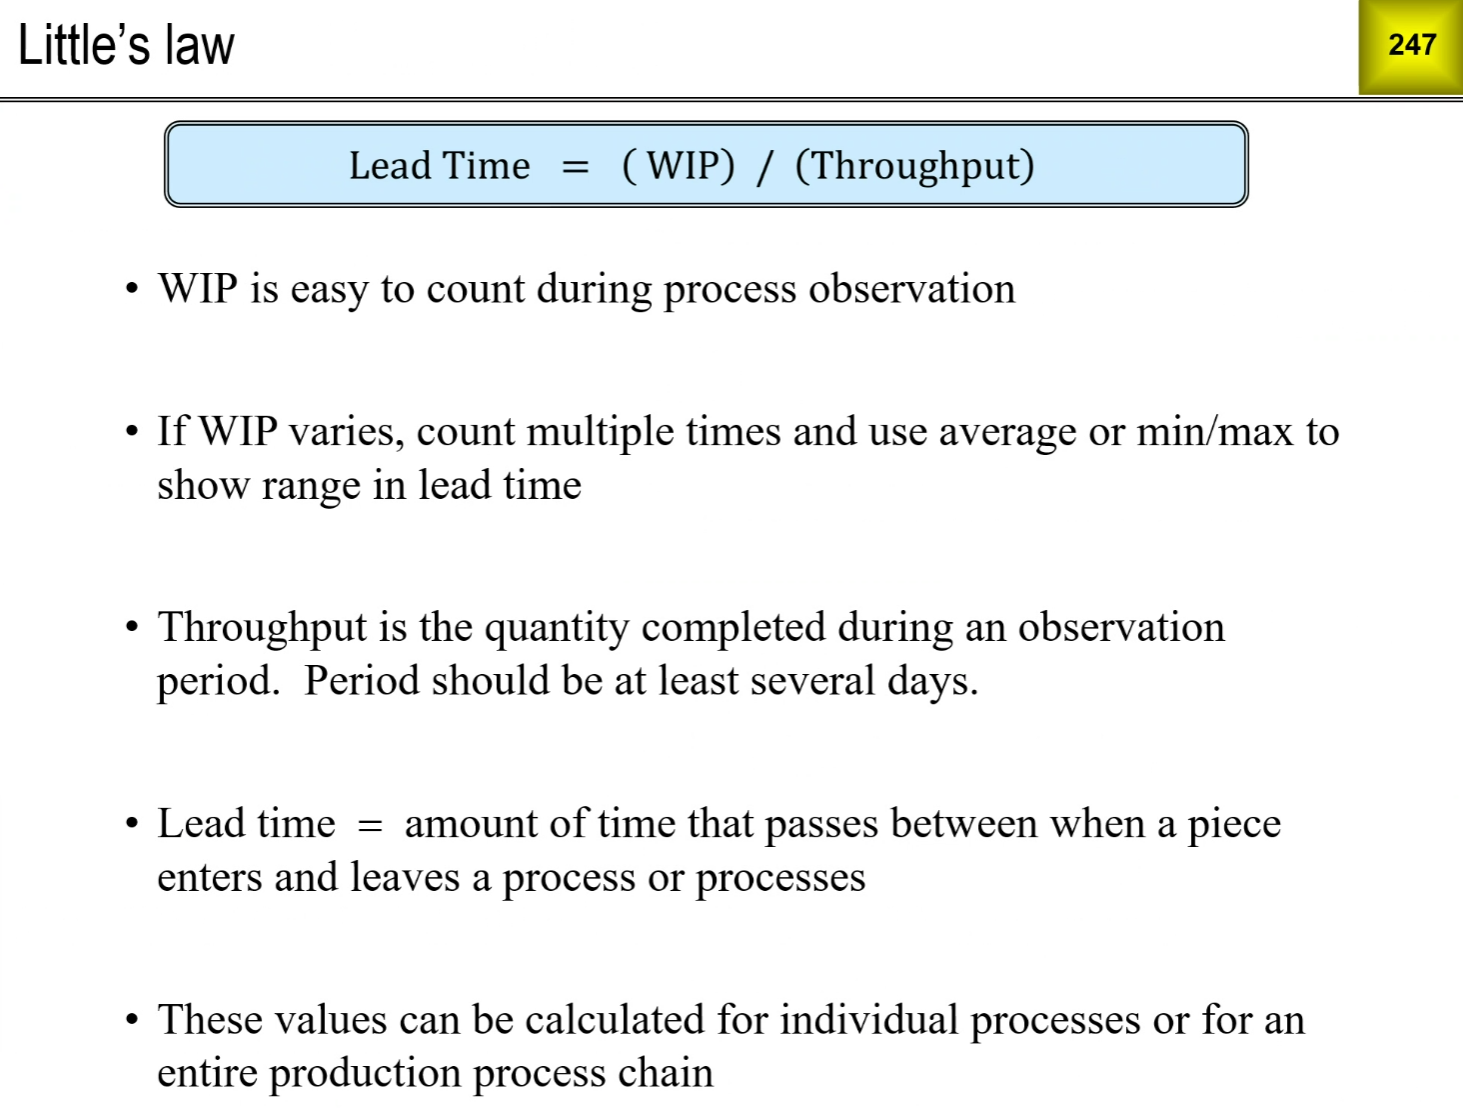
WIP/Throughput
WIP is easy to count during process observation
if WIP varies, count multiple times and use average or min/max to show range in lead time
throughput is the quantity completed during an observation period. Period should be at least several days.
Lead time = amount of time that passes between when a piece enters and leaves a process or processes
These values can be calculated for individual processes or for an entire production process chain
Lecture from 9/11/25
Review
A (Slide 150)
D
B
A (reference slide 204)
A
B
D
D (slide 66)
A (slide 66)
A
A
D
B
D
C
X and Y Variables
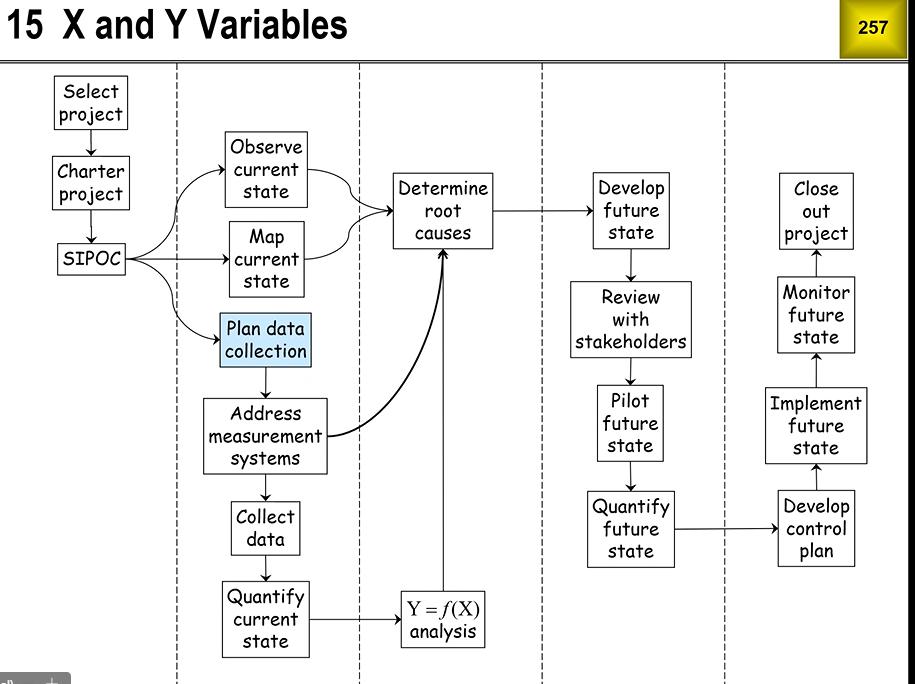
- X variables are inputs, your Y variables are your outputs
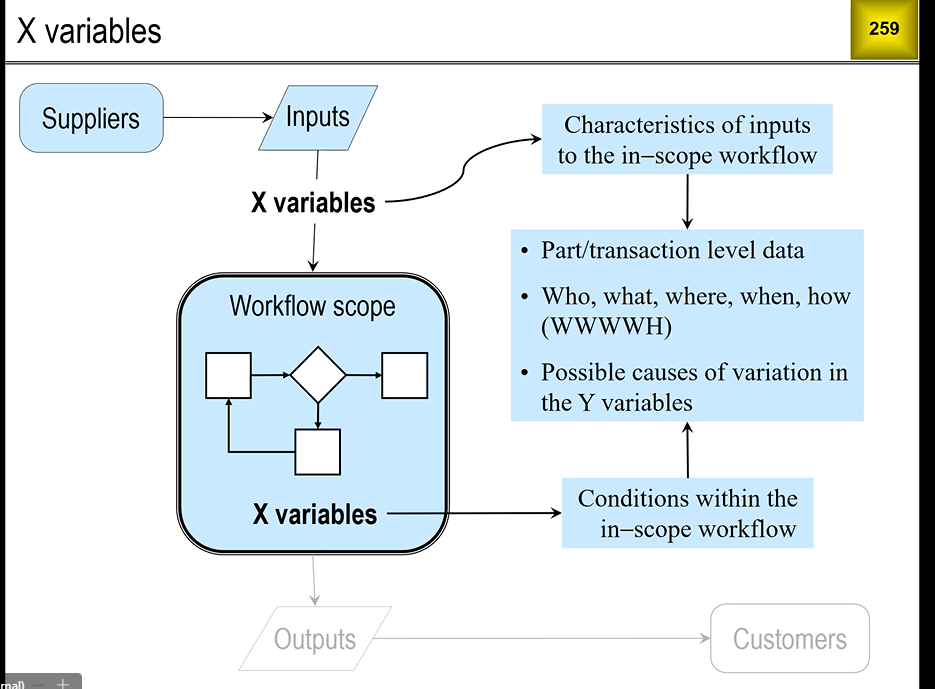
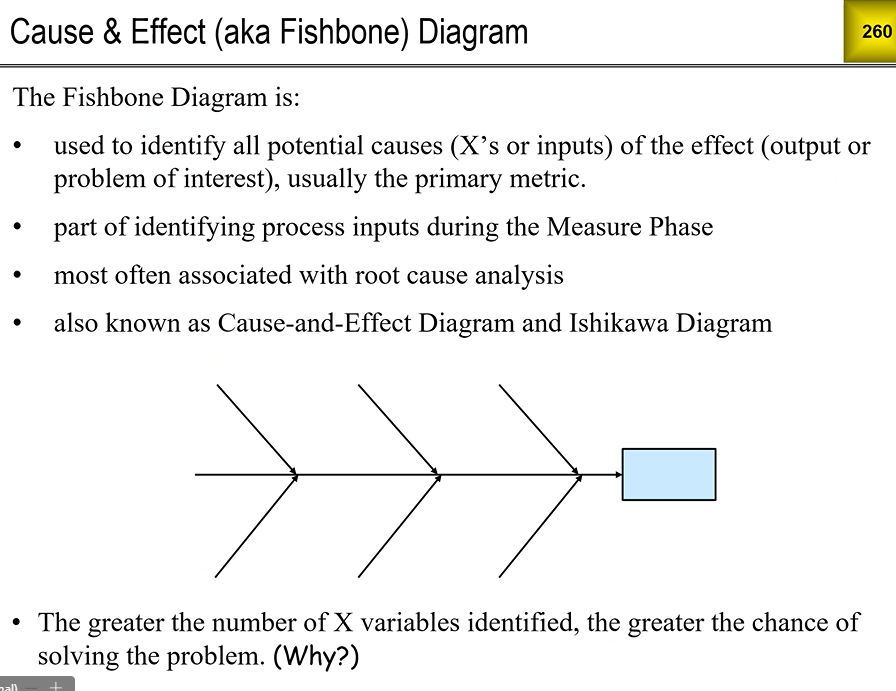
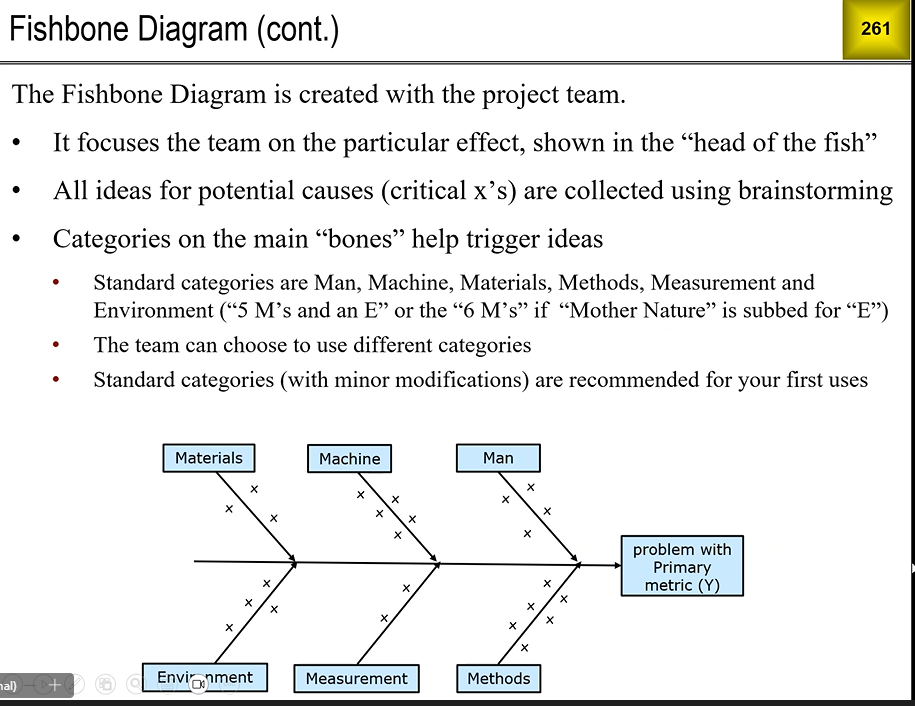
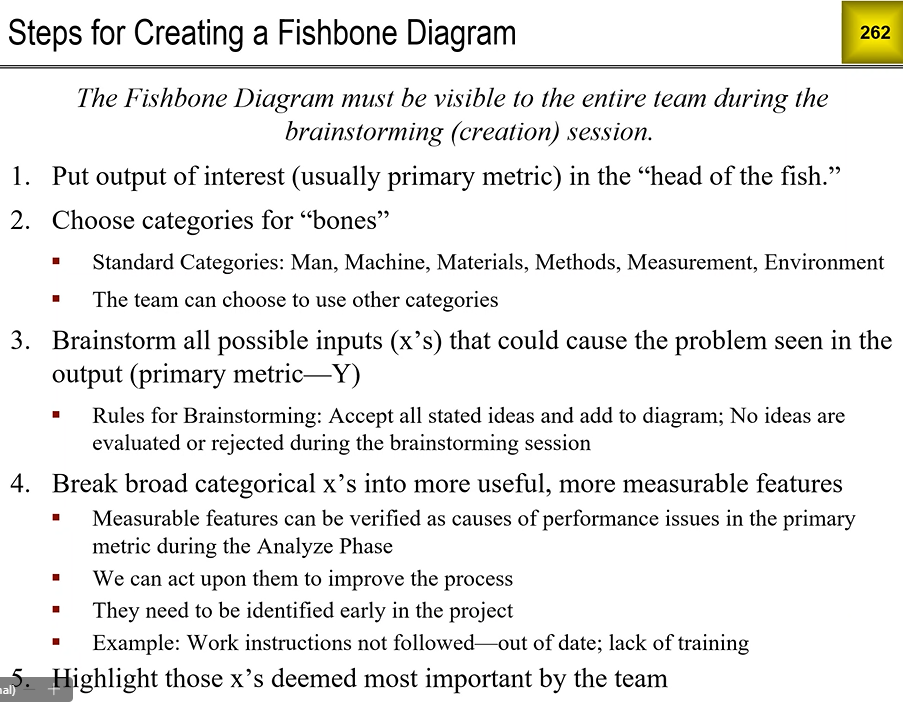
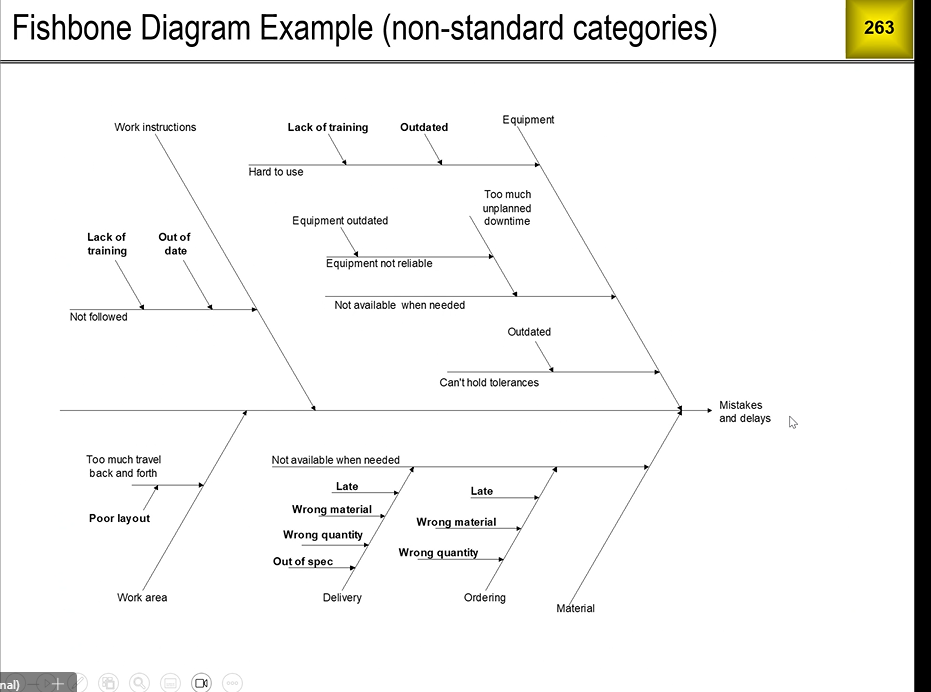
- Fishbone diagram: Used to identify all potential causes (x's or inputs) of the effect(output or problem of interest)
- part of identifying process inpuyts during the Measure Phase
- Most often associated with Root Cause analysis
- The greater number of X variables identified, the greater the chance of solving the problem
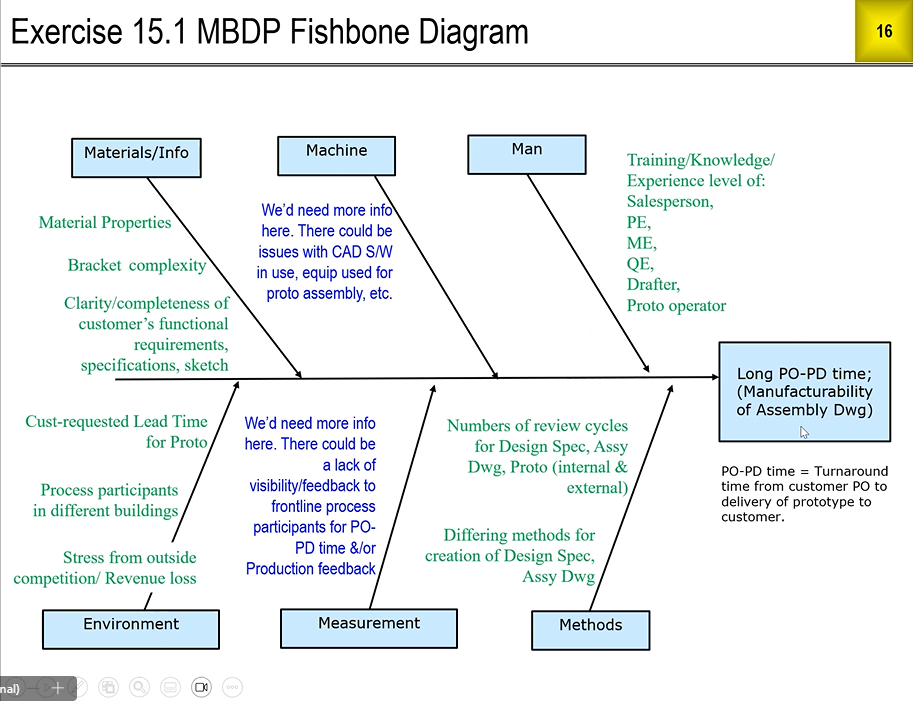
Examples
Problem meeting delivery date
- man
- manpower
- training
- machine
- slow machine output
- materials
- materials ordering process
- material on hand
- method
- workflow from quote to product
- environment
- poor layout of manufacturing area
- measurement
- where we measure stuff
Lecture 9/12/25
Lecture 9/25/25
Quiz
Q1 We want to do an analysis to determine whether getting a customer order from a quote is more likely or less likely depending on which account manager submitted the request for quote to the customer, which business unit created the quote, and the turnaround time. What is the Y variable for this analysis?
a) Which account manager
b) Turnaround time
c) Whether or not we got a customer order
d) Which business unit
Answer: c) Whether or not we got a customer order (the outcome/dependent variable).
Q2 We want to do another analysis using all four variables listed below. Which of these choices (a, b, c, or d) would be the Y variable, i.e., the one that could be dependent on the other three?
a) Whether or not review by Legal was required
b) Whether or not the quote was submitted on time to the customer
c) Whether or not review by Finance was required
d) Whether or not review by Service was required
Answer: b) Whether or not the quote was submitted on time to the customer.
Reason: Timing plausibly depends on whether Legal/Finance/Service reviews were required; the reverse dependence is unlikely.
Q3 Suppose that a population of interest can be divided into several homogeneous sub-populations of equal size. Which sample will be most representative of the population?
a) A random sample from the sub-population for which the data can be obtained most quickly.
b) A random sample from the sub-population for which the data can be obtained most inexpensively.
c) Random samples of the same size from each sub-population.
d) A random sample from the whole population.
Answer: c) Random samples of the same size from each sub-population.
Reason: With homogeneous strata of equal size, taking equal-size random samples from each stratum (proportional stratified sampling) ensures all sub-populations are represented and typically yields lower variance than a single simple random sample.
Q4 Which of these statements about random sampling is always true?
a) The sample data looks random when you plot it.
b) A random number generator is used to select the items in the sample.
c) The items in the sample are equally spaced in time or location.
d) It gives a smaller margin of error than other sampling methods.
Answer: b) A random number generator is used to select the items in the sample.
Reason: Random sampling requires a chance mechanism (e.g., RNG, random digits) to select units. The plot may look patterned, items aren’t equally spaced, and the margin of error isn’t guaranteed smaller than other designs.
Q5 Which of these is NOT a description of the standard data matrix format?
a) Columns are fields, rows are records.
b) Columns are records, rows are fields.
c) It is the format required by Pivot Tables.
d) Each data variable must appear in only one column.
Answer: b) Columns are records, rows are fields.
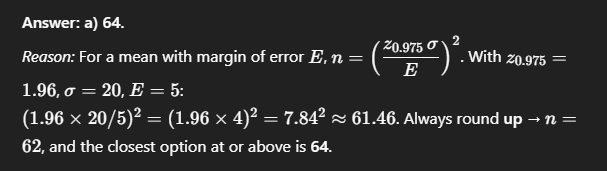
Q6 We want to collect data to estimate a population mean. We think the sample standard deviation will be about 20, and we want a margin of error equal to 5. Like almost everyone else who does this sort of thing, we will use the 95% confidence level. What is the required sample size?
a) 64
b) 84
c) 44
d) 24
Answer: a) 64.
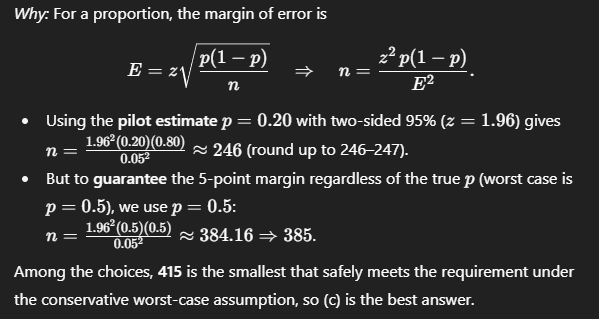
Q7 We want to collect data to estimate a population percent defective. Our guess for the percent defective is 20. We want an upper margin of error equal to 5 percentage points (i.e., an upper bound of 25 on the population percent defective) at the 95% confidence level. What is the required sample size?
a) 613
b) 811
c) 415
d) 217
Answer: c) 415.
Q8 Which of these is NOT a description of the standard data matrix format?
a) Columns are fields, rows are records.
b) Columns are records, rows are fields.
c) It is the format required by Pivot Tables.
d) Each data variable must appear in only one column.
Answer: b) Columns are records, rows are fields.
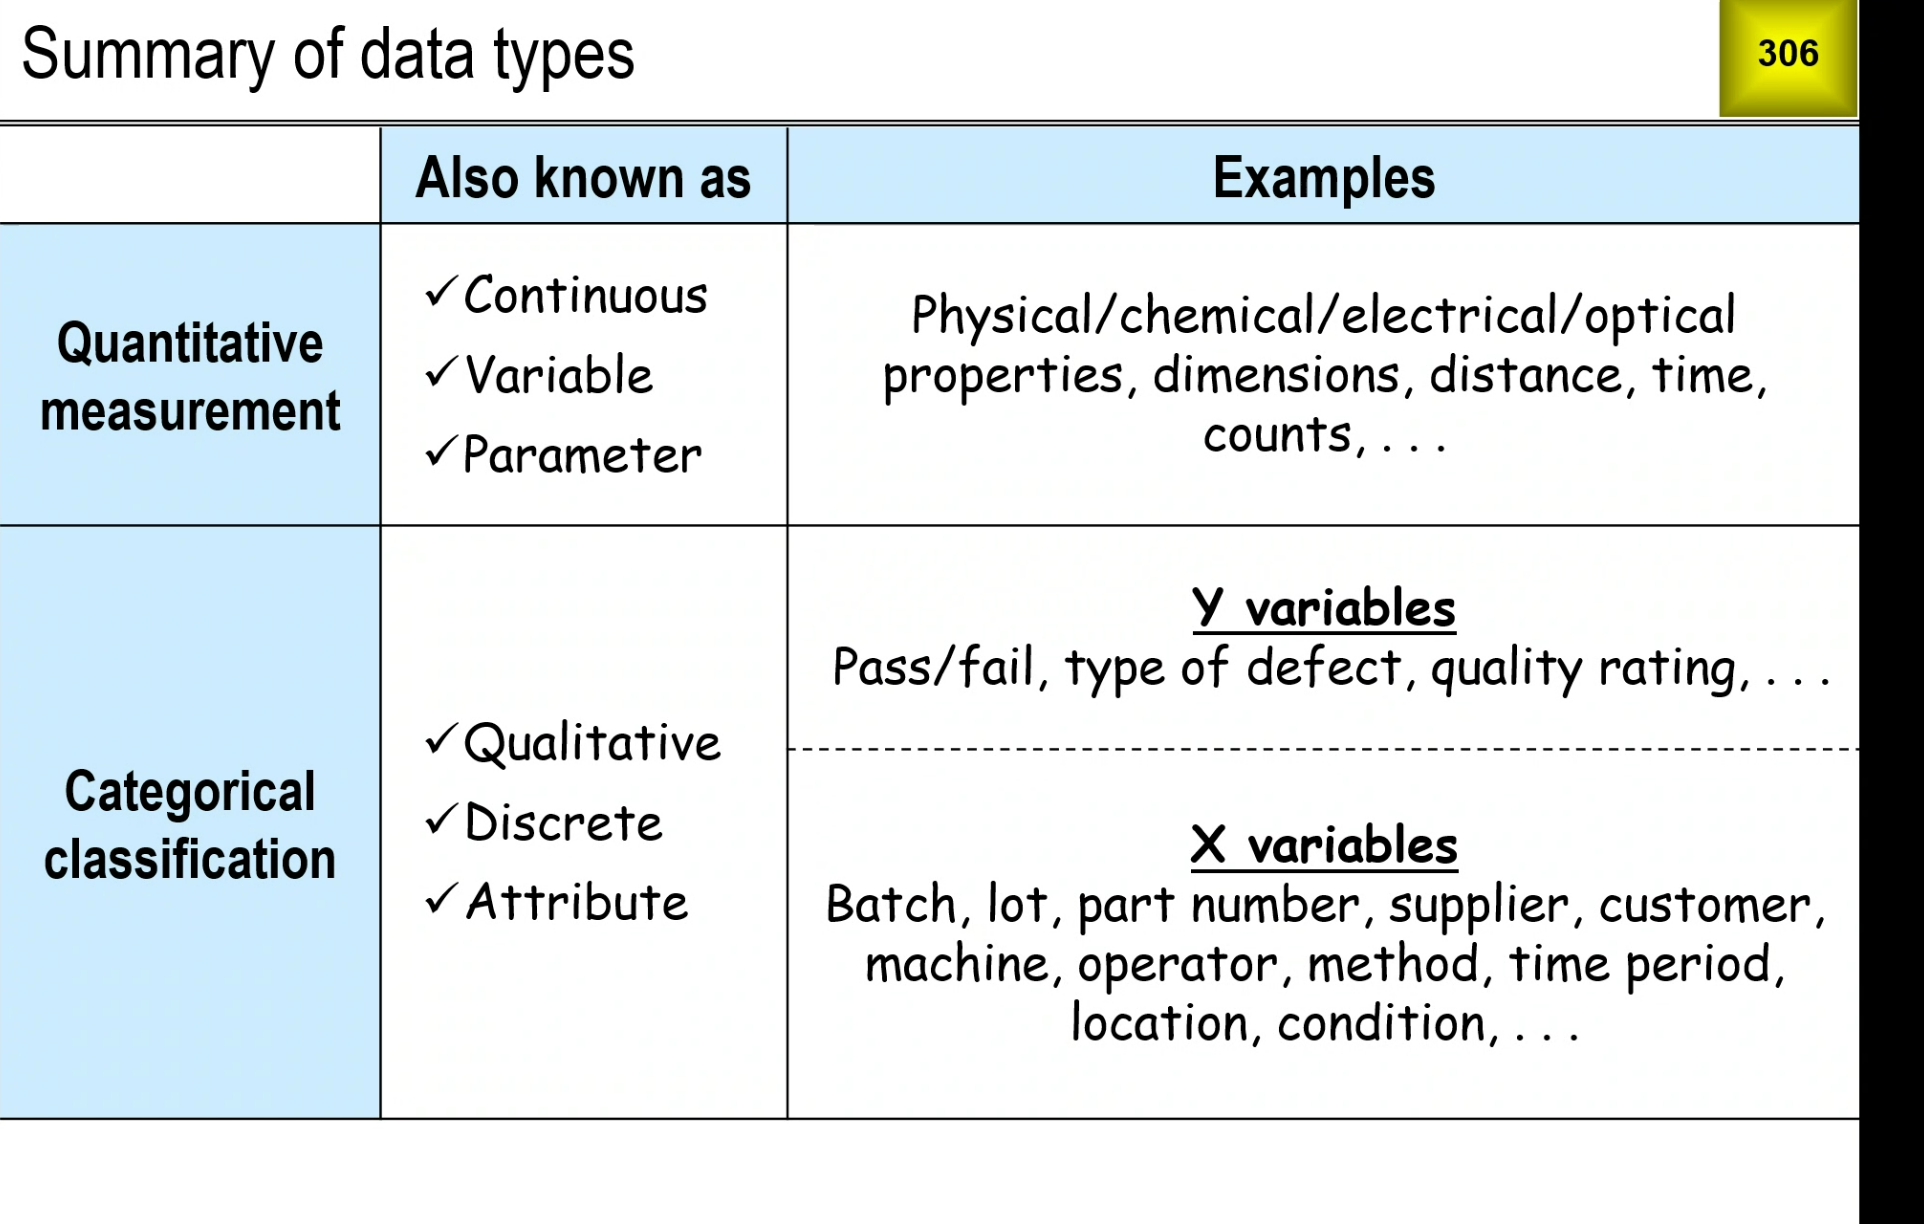
Q9 Which of these variables is a quantitative measurement?
a) The order entry time
b) Whether or not an order is complete
c) Whether or not an order is accurate
d) Who enters the order
Answer: a) The order entry time.
Reason: It can be measured numerically (e.g., time of day or elapsed minutes). The others are categorical/binary.
Q10 Which of these variables is a categorical classification?
a) The order quantity
b) The product that is being ordered
c) The dollar value of an order
d) The order processing time
Answer: b) The product that is being ordered.
Reason: Product is a label/category (e.g., SKU/type). The others are numeric measurements.
Q11 We have a quantitative variable that follows a Normal distribution with mean 50 and standard deviation 5. What percentage of future observations will exceed 60?
a) 5.00
b) 2.28
c) 1.96
d) 97.72
Answer: b) 2.28%.

Q12 Which of the following statistics is a measure of process variation?
a) Standard deviation
b) Standard error
c) Sum
d) Minimum
Answer: a) Standard deviation.
Reason: Standard deviation quantifies spread/variation of individual observations in a process; standard error measures variability of a statistic (e.g., the sample mean), not the process itself.
Q13 Suppose we have a quantitative measurement system for which standards are NOT available. What is the primary objective of measurement system analysis in this case?
a) Determine the bias of the measurement system.
b) Determine the percentage of good items that are failed.
c) Determine the standard deviation attributable to the measurement system.
d) Determine the percentage of bad items that are passed.
Answer: c) Determine the standard deviation attributable to the measurement system.
Reason: Without traceable standards you can’t assess bias; MSA then focuses on precision (repeatability/reproducibility)—i.e., the measurement system’s variance.
Q14 Suppose we have a quantitative MSA involving 5 items, 9 appraisers, and 2 sessions. What is the number of degrees of freedom for repeatability?
a) 45
b) 85
c) 90
d) 40
Answer: a) 45.
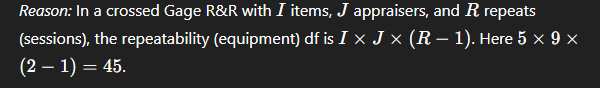
Q15 Suppose we have a quantitative MSA involving 5 items, 9 appraisers, and 2 sessions. What is the number of degrees of freedom for repeatability?
a) 45
b) 85
c) 90
d) 40
Answer: a) 45.

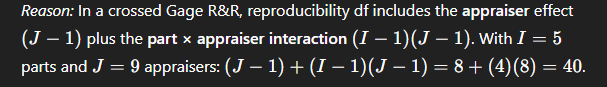
Q16 For the MSA in the previous question, what is the number of degrees of freedom for reproducibility?
a) 90
b) 85
c) 45
d) 40
Answer: d) 40.
Q17 Which of these is NOT a result of measurement system variation?
a) Making process capability look worse than it really is.
b) Making process capability look better than it really is.
c) Passing bad items.
d) Failing good items.
Answer: b) Making process capability look better than it really is.
Reason: Measurement error typically increases observed variability (and/or causes misclassification), which degrades apparent capability or leads to passing bad/failing good— it doesn’t make capability look better.
Q18 Which Excel tool is needed for a quantitative measurement system analysis involving multiple parts and multiple appraisers?
a) Data Analysis → Anova: Single Factor
b) Data Analysis → Descriptive Statistics
c) Data Analysis → Regression
d) Data Analysis → Anova: Two-Factor with Replication
Answer: d) Data Analysis → Anova: Two-Factor with Replication.
Reason: A crossed Gage R&R involves two factors (Parts × Appraisers) and requires a two-way ANOVA with replication to estimate effects and interaction.
Q19 We have a quantitative measurement system for which there are 10 appraisers. Which is the better design for a measurement system analysis?
a) 10 items, 3 appraisers, 3 sessions.
b) 5 items, 9 appraisers, 2 sessions.
c) 9 items, 10 appraisers, 1 session.
d) 1 item, 10 appraisers, 9 sessions.
Answer: B) 5 items, 9 appraisers, 2 sessions.
Reason: Better design will always have 2 sessions